Bitcoin Slumps Twice Below the Psychological Price Level of $20k

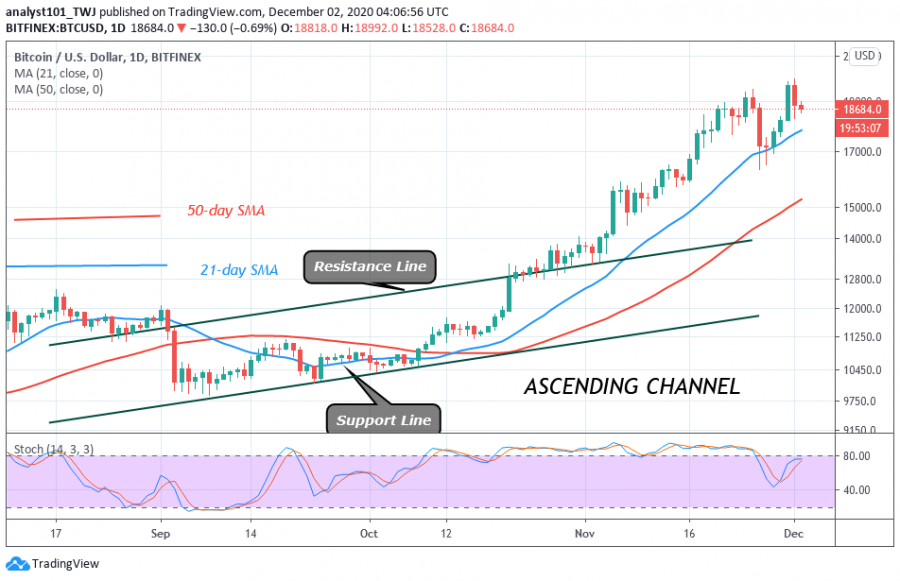
Bitcoin bulls have made two attempts at the $20,000 overhead resistance. The king coin encountered bearish consequences after it attempted to breach the psychological price level.
On November 24, buyers pushed the price to $19,400 but failed to breach the overhead resistance. BTC slumped to $16,400 low. On November 30, the buyers came close to breaching the overhead resistance but were repelled at the $19,740 high.
The crypto fell to $18,528 low and corrected upward. However, the BTC price has resumed a downward move after retesting the $19,600 resistance. Perhaps, Bitcoin will attempt to revisit the previous low at $16,600. The bottom line is that BTC will be range-bound between $16,600 and $20,000 if the overhead resistance remains unbroken. On the other hand, if buyers pushed the price above $20,000, a rally above $22,000 is likely. The coin is trading at $18,000 at the time of writing.
Bitcoin indicator reading
Bitcoin has risen to level 80 of Relative strength Index period 14. It indicates that the coin is in the overbought region of the market. Bitcoin is in a strong trend as the market rises in the overbought region. The 21-day SMA and the 50-day SMA are sloping northward indicating the uptrend. The 21-day SMA is acting as the support level for BTC price.

Key Resistance Zones: $13,000, $14,000, $15,000
Key Support Zones: $7,000, $6,000, $5,000
What is the next direction for BTC/USD?
Bitcoin is falling as a result of the rejection at the $19740 price level. The Fibonacci tool indicates a further upward movement of the coin. On November 30 uptrend; a retraced candle body tested the 61.8% Fibonacci retracement level. It indicates that the market will rise and reach level 1.618 Fibonacci retracement level or the high of $21.988.80.

Disclaimer. This analysis and forecast are the personal opinions of the author that are not a recommendation to buy or sell cryptocurrency and should not be viewed as an endorsement by CoinIdol. Readers should do their own research before investing funds.
Price
News
Price
Price
Price

(0 comments)