Bitcoin Retreats From The $96,400 Level
Updated: Jan 01, 2025 at 19:15

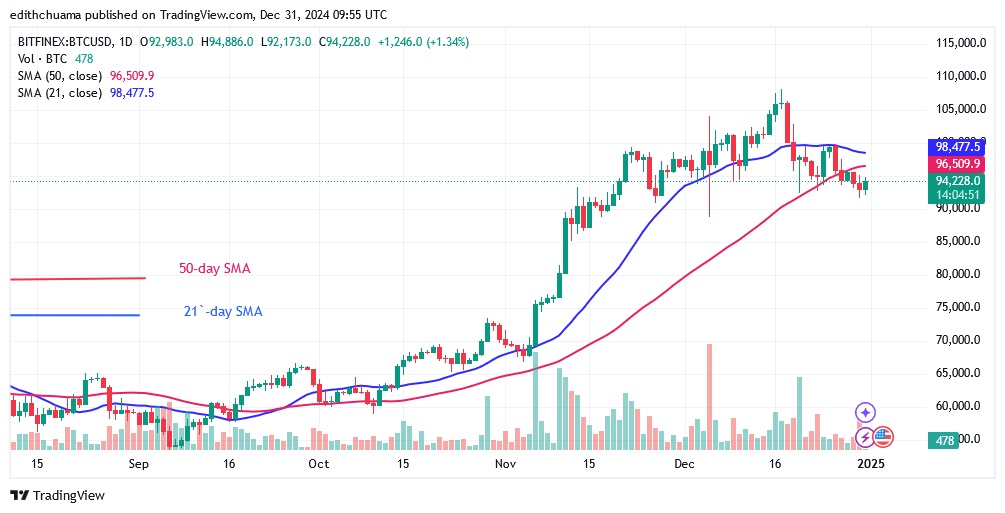
The Bitcoin (BTC) price has fallen from its high of $108,364 to a sideways trend. Cryptocurrency price analysis brought by Coinidol.com.
Bitcoin price long term analysis: bullish
BTC is trading in a narrow range between the $92,000 support level and the 50-day SMA resistance. Bitcoin is trading below its previous high in anticipation of an uptrend. However, it is unlikely to continue its uptrend after falling below the 50-day moving average line.
On the downside, a break below the $92,000 support will see Bitcoin fall to a low of $90,000. The bearish momentum will continue to the previous low above $85,000. In the meantime, Bitcoin is climbing after retesting the current support of $92,000.
BTC indicator reading
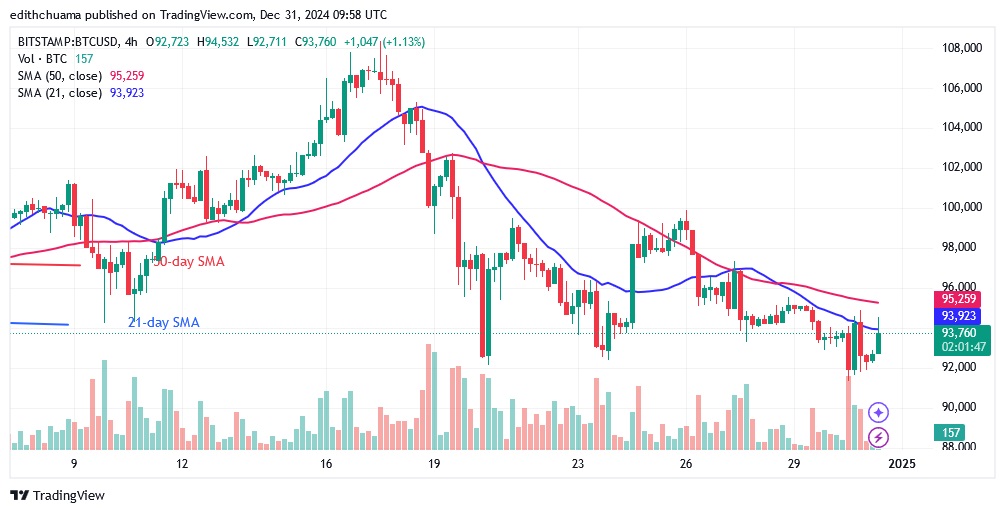
The price bars are below the 50-day SMA, limiting the upside correction. On the 4-hour chart, the price bars are between the moving average lines, indicating that the cryptocurrency is moving within a range. Bitcoin price is trying to break above the 50-day SMA but has pulled back to the moving average lines.

Technical indicators:
Resistance Levels – $90,000 and $110,000
Support Levels – $70,000 and $50,000
What cryptocurrency section for BTC/USD?
On the 4-hour chart, Bitcoin is below the moving average lines. The largest cryptocurrency is trading in a range between $92,000 and $100,000, below the resistance level.
Today, Bitcoin's upward trend has been resisted, as the altcoin continues to fluctuate below it.

Disclaimer. This analysis and forecast are the personal opinions of the author, are not a recommendation to buy or sell cryptocurrency, and should not be viewed as an endorsement by CoinIdol.com. Readers should do their research before investing in funds.
Coin expert
Price
Price
Price
News

(0 comments)