Bitcoin in a Tight Range as Bulls Battle the Resistance at $59,000

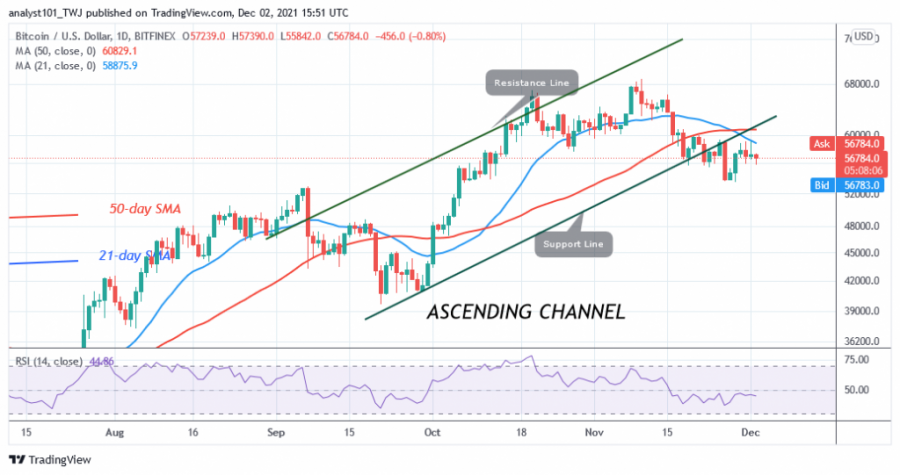
The price of Bitcoin (BTC) is in a downward correction. Today, the BTC price fell to the low of $55,842 as the bulls bought the dips.
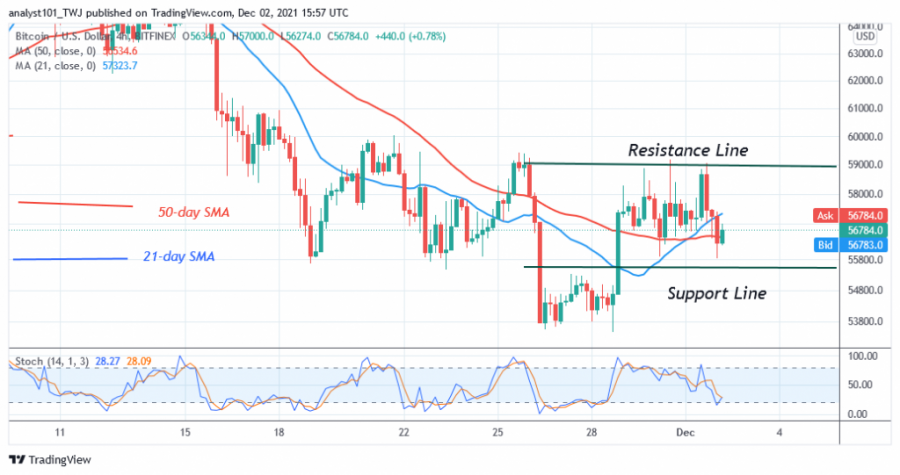
On November 30, the bitcoin price dropped to the low of $55,899 and then rebounded. Since the downward impulse on November 26, BTC/USD has been in a trading range, fluctuating between $55,800 and $59,000.
After Bitcoin recovered from the $55,800 support level, buyers are focused on breaking the $59,000 resistance level, but based on the price action so far, buyers have failed to keep BTC above the $59,000 high. A break above the recent high will lead Bitcoin to rally above $60,000. This will prompt buyers to retarget the higher resistance zones at $67,000 and $69,000. On the other hand, if buyers fail to break the recent high, Bitcoin will fall to $54,000 and later to the $52,000 price level.
Bitcoin indicator reading
Bitcoin is at level 44 of the Relative Strength Index of period 14. The cryptocurrency has fallen and is in the downtrend zone below the centre line 50. Also, the cryptocurrency price is below the moving averages as it was rejected at the recent high. Bitcoin is now in a bullish momentum above the 25% area of the daily stochastic.

Technical indicators:
Major Resistance Levels – $65,000 and $70,000
Major Support Levels – $60,000 and $55,000
What is the next direction for BTC?
On the 4-hour chart, Bitcoin is in a sideways trend as it is moving in a narrow price range. Over the past week, Bitcoin has traded between $55,800 and $59,000. Buyers tested the resistance level three times without breaking it. Today, the BTC price is moving up to test the resistance level again.

Disclaimer. This analysis and forecast are the personal opinions of the author and are not a recommendation to buy or sell cryptocurrency and should not be viewed as an endorsement by CoinIdol. Readers should do their own research before investing funds.
Price
Coin expert
Price
Price
Price

(0 comments)