Bitcoin Breaks Crucial Resistance at $40,500, Rallies to $48,000 High
Updated: Feb 10, 2021 at 12:15

BTC/USD has finally broken and crossed the psychological price level of $40,000. On February 8, the bulls broke the $40,500 resistance and rallied to a $48,000 high.
The rally reached the $48,000 high but was repelled. The price retraced to $45,000 support but resumed to retest the recent high. Today, the BTC price is fluctuating between $45,000 and $48,000. The market has risen to $46,839 at the time of writing.
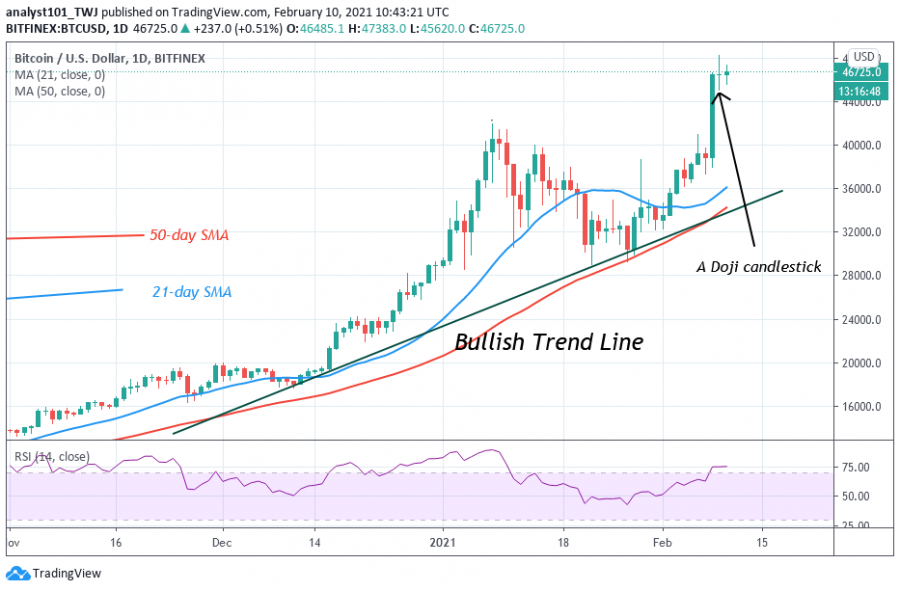
However, a further upward move is doubtful with the appearance of a Doji candlestick. The candlestick is describing that the uptrend is losing strength. Buyers are unable to continue with the uptrend as sellers emerge to push prices to the $45,000 support. In the previous price action, the bulls could not sustain the bullish momentum above $40,000 resistance. Consequently, the cryptocurrency fell and has been in a downward correction since January 8.
Bitcoin indicator reading
Bitcoin has risen to level 75 of the Relative Strength Index period 14. The market is now in the overbought region. It is unlikely for a price to rally on the upside as the market reaches the overbought region. However, in a strong trending market, the overbought conditions may not hold.

Technical indicators:
Major Resistance Levels – $48,000 and $50,000
Major Support Levels – $40,000 and $38,000
What is the next direction for BTC/USD?
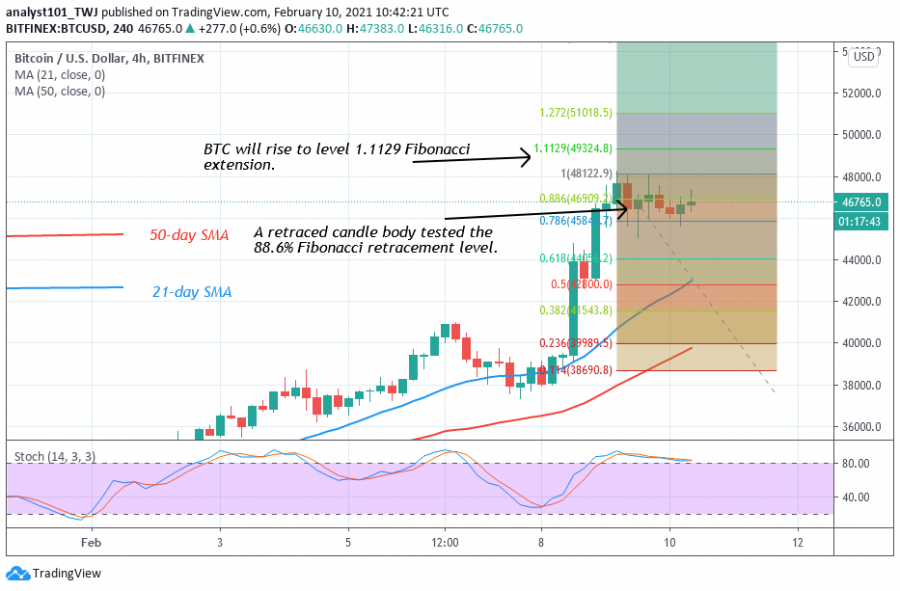
Nevertheless, the BTC price is fluctuating in the current price range. On February 9 uptrend; a retraced candle body tested the 88.6 % Fibonacci retracement level. The retracement indicates that BTC will rise to level 1.1129 Fibonacci extensions. That is a high of $49,324.80. The market will continue to rise if the bullish momentum is sustained.

Disclaimer. This analysis and forecast are the personal opinions of the author that are not a recommendation to buy or sell cryptocurrency and should not be viewed as an endorsement by CoinIdol. Readers should do their own research before investing funds.
News
Price
Price
News
Price

(0 comments)