Bitcoin Jumps Above $26,000 And Continues Its Upward Trend
Updated: May 15, 2023 at 10:22

The Bitcoin (BTC) price has regained upward momentum after jumping above the $26,000 level.
Bitcoin price long-term forecast: bearish
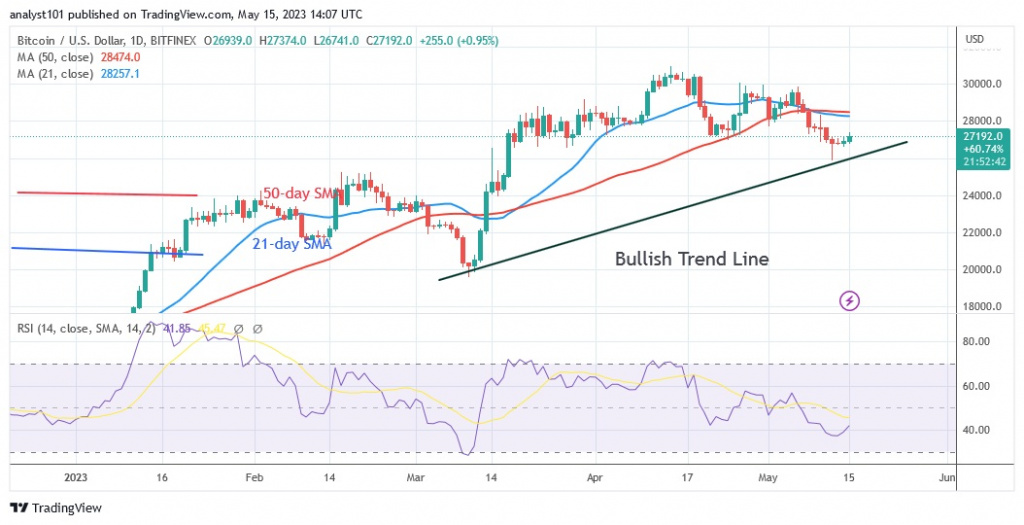
The bitcoin price has reached the $27,000 to $30,000 range where it was previously. As of press time, the price of one bitcoin has risen to $27,414 today. However, the high at $28,500 is believed to be resistance to the current positive trend. If buyers manage to keep the price above the moving average lines or the barrier above $28,500, bitcoin will resume its positive trend. The cryptocurrency's previous highs of $29,000 and $30,000 will be reached again. In contrast, Bitcoin will be forced to move in a range if the recent high is rejected. The price range for the cryptocurrency value is $26,000 to $28,000. The cryptocurrency value is currently moving towards an overbought region of the market, which will hinder its uptrend.
Bitcoin indicator display
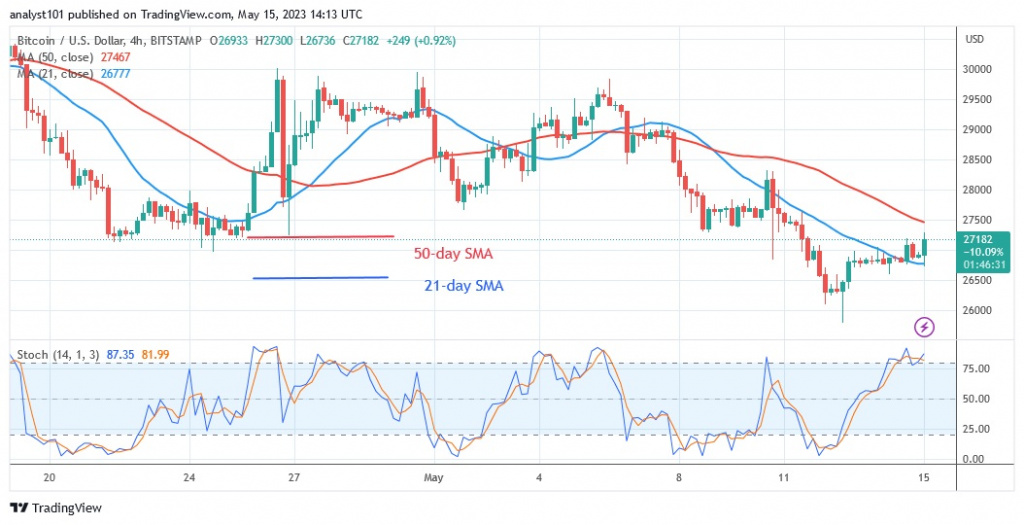
On the Relative Strength Index for the 14 period, Bitcoin is at level 45. Despite the upside reversal, the largest altcoin is in the downtrend zone. Similarly, the price bars continue to be below the moving average lines that have been driving the prices down. The BTC price is moving upwards above the daily stochastic of 80. The bitcoin market is now overbought. When sellers appear in the overbought area of the market, there is a risk that the bitcoin price will fall.

Technical indicators:
Key resistance levels - $30,000 and $35,000
Key support levels - $20,000 and $15,000
What is the next direction for BTC/USD?
BTC/USD is on the way back up after the recent rise above the $26,000 threshold. In the short term, the BTC price is trapped between the moving average lines. Therefore, the upward movement will be limited to the area between the moving average lines. Bitcoin will develop when the moving average lines cross.

Disclaimer. This analysis and forecast are the personal opinions of the author and are not a recommendation to buy or sell cryptocurrency and should not be viewed as an endorsement by CoinIdol. Readers should do their research before investing in funds.
News
Price
News
Price
Price

(0 comments)