Bitcoin Holds above $16.4k, Battles Resistance at $18.8k for More Upside

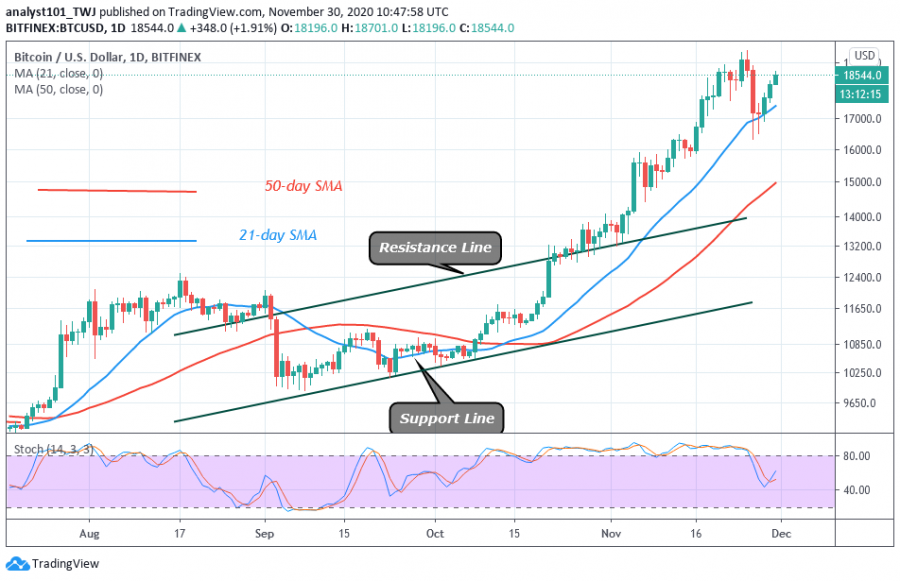
Following the recent breakdown on November 26, buyers have been attempting to push BTC to the previous high above $19,400. Bitcoin has earlier plunged to $16,400 for failing to breach the $19,400 resistance.
Traders believed that a repeat of the price action of December 11, 2017, may occur. In that year, Bitcoin rallied to $20,000 but dropped sharply after failing to break above the recent high. In the price action of November 26, 2020, BTC plunged to a low of $16,400 low but the candlesticks with long tails are pointing to the support level.
The candlesticks with long tails are indicating that there is buying pressure at lower price levels. Nevertheless, the downtrend has been terminated as bulls buy the dips to push the price upward. Nevertheless, the bulls are retesting the $18,800 resistance and trying to break above it. Today, if the bulls break above $18,800, a rally above $19,000 is likely. However, if buyers fail to break the resistance, Bitcoin will be compelled to a sideways move.
Bitcoin indicator reading
After the recent breakdown, the 21-day SMA is acting as support as BTC resumes a fresh uptrend. The coin has also fallen from the overbought region of the market. It is above the 40% range of the daily stochastic. This indicates that it has bullish momentum.

Key Resistance Zones: $13,000, $14,000, $15,000
Key Support Zones: $7,000, $6,000, $5,000
What is the next direction for BTC/USD?
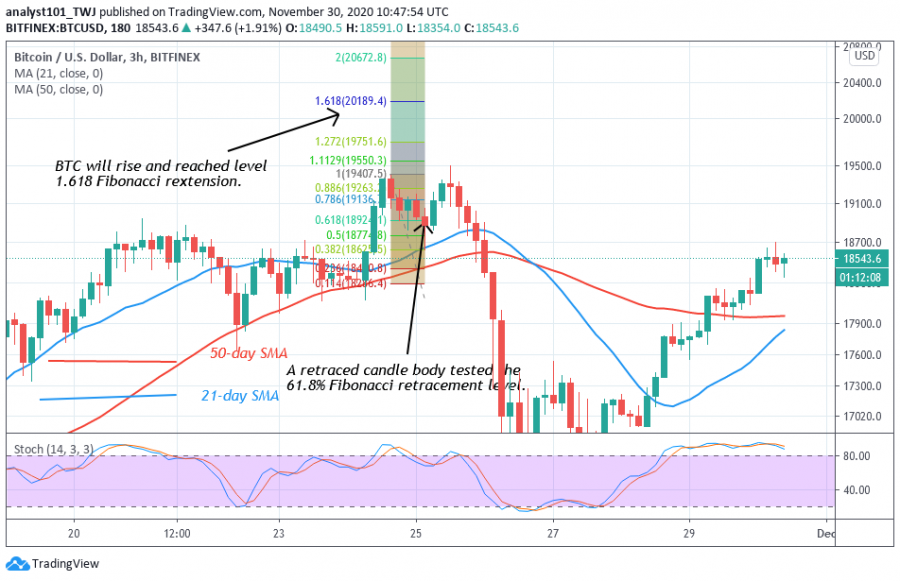
Bitcoin is resuming a fresh uptrend to reach the previous highs. The Fibonacci tool indicated a possible upward move of the coin. On November 24 uptrend; a retraced candle body tested the 61.8% Fibonacci retracement level. This implies that the coin will rise and reach level 1.618 Fibonacci extensions. In other words, Bitcoin will rise and reach a high of $20,189.50.

Disclaimer. This analysis and forecast are the personal opinions of the author that are not a recommendation to buy or sell cryptocurrency and should not be viewed as an endorsement by CoinIdol. Readers should do their own research before investing funds.
Price
Price
Price
Price
Price

(0 comments)