Bitcoin Falters Above $27,600 As It Reaches An Overbought Region
Updated: Oct 06, 2023 at 11:18

Bitcoin (BTC) price has once again started to rise after crossing the moving average lines. Cryptocurrency price analysis by Coinidol.com.
Bitcoin (BTC) Price Long-Term Forecast: Bullish
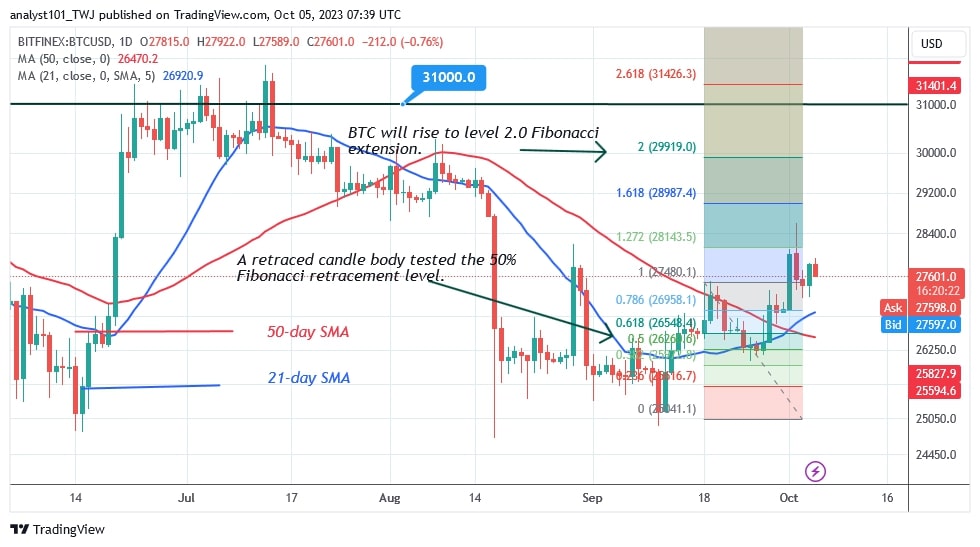
Bitcoin price has started a series of higher highs and higher lows. BTC rose to a high of $28,611 on Oct. 2, but was then pushed back. Today, the price of the largest cryptocurrency is at $27,662.
Bitcoin is now trading below resistance of $28,400. Bitcoin is benefiting from the possibility of a rise as it is trading above the moving average lines. Moreover, the price indicator suggests that the cryptocurrency could rise.
A bearish candlestick tested the 50% Fibonacci retracement level of the September 18 upswing. The retracement suggests that BTC will rise to the 2.0 Fibonacci extension level in the future, i.e. $29,919. Bitcoin will be forced to resume its sideways trend between $26,850 and $28,400 if the bullish scenario is invalidated. Today, October 5, Bitcoin is fluctuating above $27,600.
Bitcoin (BTC) Indicator Reading
The largest cryptocurrency is currently trading above the moving average lines or in the uptrend zone. When the price bars are above the moving average lines, the crypto price tends to rise. The crossover is bullish for bitcoin. In other words, a bullish order is indicated when the 21-day line SMA crosses the 50-day line SMA. Bullish exhaustion has been reached on the upside as it approaches overbought territory.
Technical Indicators:
Key resistance levels – $30,000 and $35,000
Important support levels – $20,000 and $15,000

What does the next direction look like for BTC/USD?
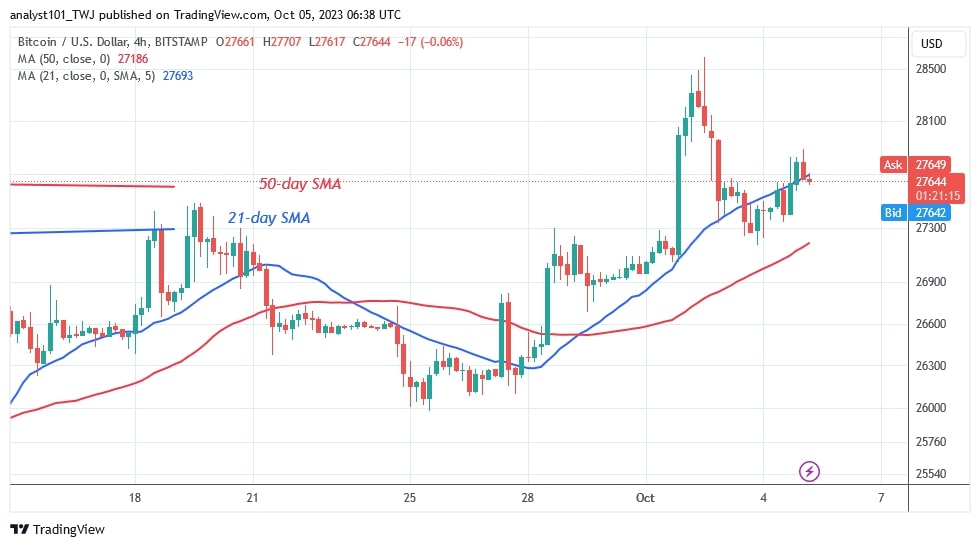
The largest cryptocurrency is currently fluctuating between $26,850 and $28,400. The recent price action remained stable above the $27,600 support.
Bitcoin's upward momentum will continue once buyers break the $28,400 resistance. However, BTC is at risk if the price falls below the moving average lines or support at $26,850.

On October 2, Coinidol.com reported that the BTC price will retest the psychological barrier of $30,000 if the current positive momentum is maintained above the $28,000 support.
Disclaimer. This analysis and forecast are the personal opinions of the author and are not a recommendation to buy or sell cryptocurrency and should not be viewed as an endorsement by CoinIdol.com. Readers should do their research before investing in funds.
Price
News
News
Coin expert

(0 comments)