Bitcoin Cash Turns Down From $240 Resistance, Consolidates Above $200 Support

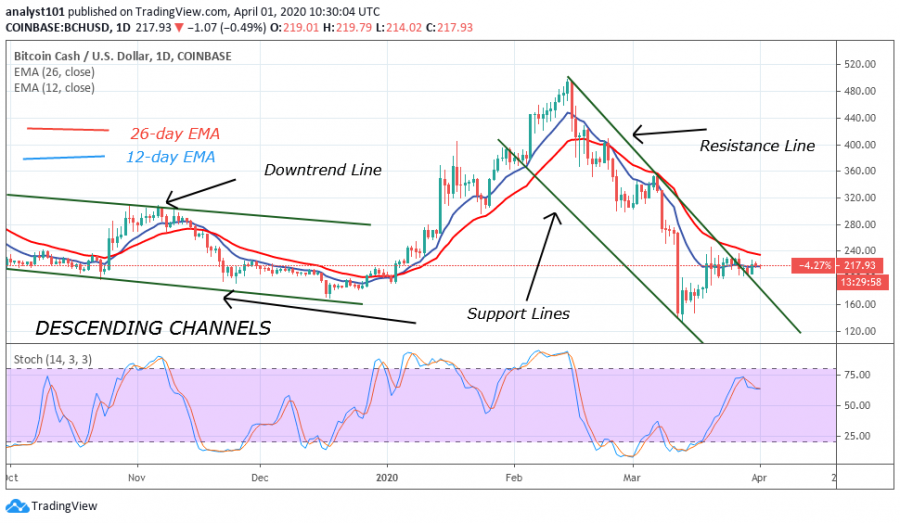
Despite its upward move and the breaking of the resistance line, BCH turned down on March 27 and resumed consolidation between $200 and $240. Surprisingly, the upward move was repelled as a result of stiff opposition at the resistance. The breaking of the resistance line is an indication of a change in trend.
The change in trend could not be affected because of the seller’s dominance at the resistance. The selling pressure is intense as the bulls fail to push BCH above $240 overhead resistance. BCH is trading at $217 at the time of writing but it is in a tight range between $200 and $240. Nonetheless, selling pressure is ongoing as the BCH reaches the $216 low. Nevertheless, the bearish momentum may extend to $200 or $197 low.
Bitcoin Cash Indicator Reading
BCH is below the 75% range of the daily stochastic. The previous bullish momentum has been erased as selling pressure resumes. Although, BACH's current momentum is weak. The EMAs are sloping horizontally indicating the sideways trend.

Key Resistance Zones: $440, $480, $520
Key Support Zones: $200, $160, $120
What is the Next Move for Bitcoin Cash?
Certainly, the current bearish trend may have subsided, but BCH is at the bottom of the chart. The current uptrend has been cut short because of the dominance of sellers at the $240 resistance. BCH lacks buyers at higher levels. Nevertheless, BCH will pick up momentum and rally above $280, if buyers are more at $240 resistance.
Disclaimer. This analysis and forecast are the personal opinions of the author that are not a recommendation to buy or sell cryptocurrency and should not be viewed as an endorsement by Coin Idol. Readers should do their own research before investing funds.
Price
Price
Price
Price
Price

(0 comments)