Bitcoin Cash Is in a Brief Surge, Battles Resistance at $210

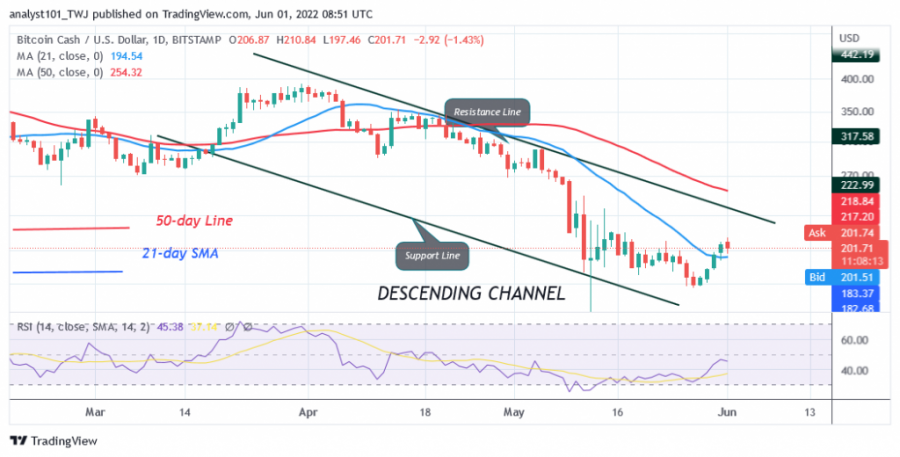
The price of Bitcoin Cash (BCH) is in a downtrend as buyers have pushed the cryptocurrency above the 21-day line SMA. The downtrend is likely to weaken as bulls have broken above the 21-day line SMA. The initial upside correction above the 21-day line SMA is encountering resistance at $210.
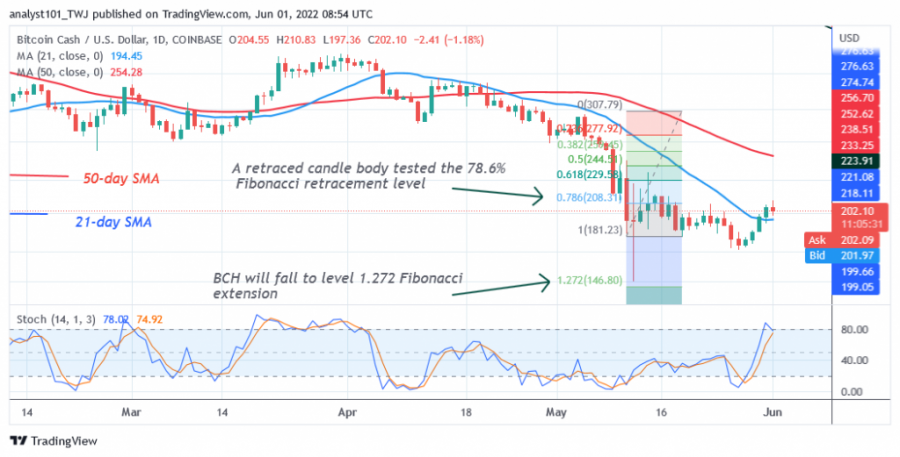
If the bulls break above $210, BCH will rise to the 50-day line SMA or the $300 high. However, if the bullish scenario is invalidated, BCH will dive back into a trading range between the moving averages. That is, the cryptocurrency will trade between the 21-day line SMA and the 50-day line SMA. Meanwhile, BCH is trading at $205 at the time of writing.
Bitcoin Cash indicator reading
Despite the upward correction, BCH is at level 46 of the Relative Strength Index for period 14. The altcoin is in the downtrend zone and can still fall. It is likely that the cryptocurrency is fluctuating between the moving averages. BCH is above the 80% area of the daily stochastic. The altcoin has moved up into the overbought zone of the market. There is a probability of a price decline.

Technical Indicators:
Key Resistance Zones: $800, $820, $840
Key Support Zones: $400, $380, $360
What is the next move for Bitcoin Cash?
Bitcoin Cash is in an upward correction as the price has broken the 21-day moving average line. The altcoin will continue its upward movement if the price stays above the 21-day moving average line. Likewise, if the bears fall below the blue line moving average, the market will fall.

Disclaimer. This analysis and forecast are the personal opinions of the author and are not a recommendation to buy or sell cryptocurrency and should not be viewed as an endorsement by Coin Idol. Readers should do their own research before investing funds.
Price
Price
News
Price

(0 comments)