Bitcoin Cash Rebounds as Bulls Revisit the Previous High of $164
Updated: Aug 24, 2022 at 11:39

The price of Bitcoin Cash (BCH) has regained momentum after a recent drop to a low of $113. On August 20, BCH rose above current support to reach a high of $140, but then fell back.
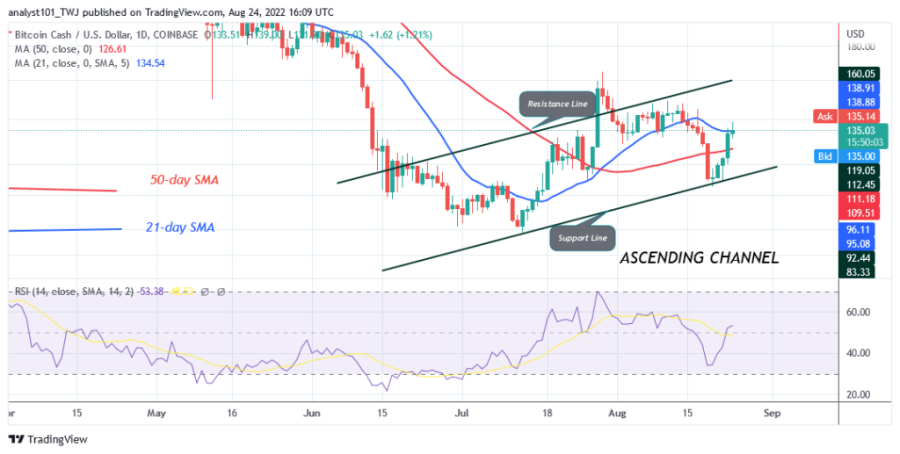
Buyers are betting on a rally to regain overriding resistance at $164. Today, the upward movement of BCH encounters rejection at the resistance zone at $140.
The cryptocurrency will continue to fall if it cannot break the recent high. In other words, BCH will resume its sideways movement if it holds above the 50-day line SMA. Meanwhile, BCH is stuck at the 21-day line SMA. The altcoin may decline and initiate a move between the moving average lines. At the time of writing, BCH is trading at $134.33.
Bitcoin Cash indicator reading
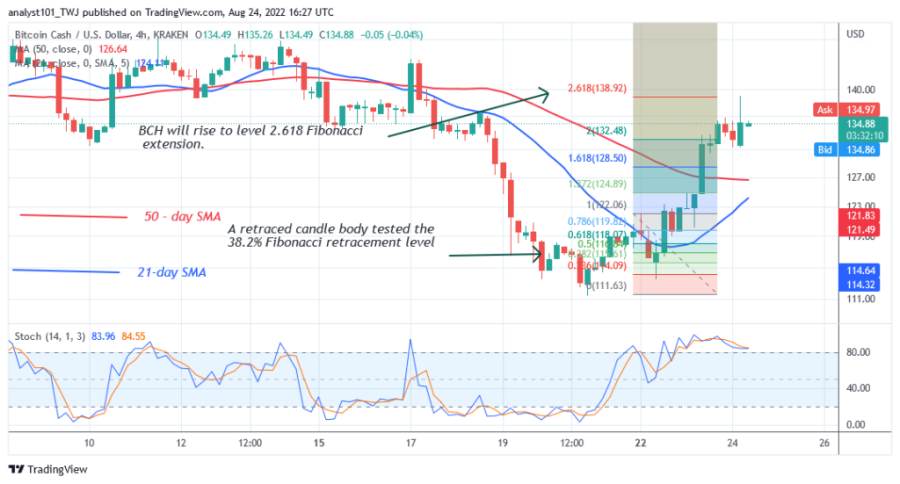
BCH is at level 52 of Relative Strength for the period 14. It is in the uptrend zone while making an upward correction. The price of the cryptocurrency is between the moving average lines, which indicates a movement within the range of the cryptocurrency. The 21-day line SMA and the 50-day line are upward sloping, indicating an uptrend. The price of the cryptocurrency is above the 80% area of the daily stochastic. This indicates that the market has reached the overbought region. Sellers will appear in the overbought region and push the prices down.

Technical Indicators
Key resistance zones: $130 and $150
Important support zones: $120 and $100
What is the next move for Bitcoin Cash?
Bitcoin Cash is in an uptrend as the altcoin has reached an overbought region at $140. In the uptrend from August 22, a retraced candle tested the 38.2% Fibonacci retracement level. The retracement suggests that BCH will rise to the 2.618 Fibonacci Extension level or $138.92. The price action shows that BCH has retested the 2.618 Fibonacci Extension level and may fall.

Disclaimer. This analysis and forecast are the personal opinions of the author and are not a recommendation to buy or sell cryptocurrency and should not be viewed as an endorsement by Coin Idol. Readers should do their own research before investing funds.
News
Price
Price
News
Coin expert

(0 comments)