Bitcoin Cash Faces Strong Rejection after Sudden Price Rally

Yesterday, BCH had a sudden price spike as the coin reached a high of $230. The price momentum crashed soon after reaching the recent highs.
Today, BCH is trading at $217 as the coin approaches the critical support at $200. Before the price spike, the crypto has earlier plunged to the low at $212.
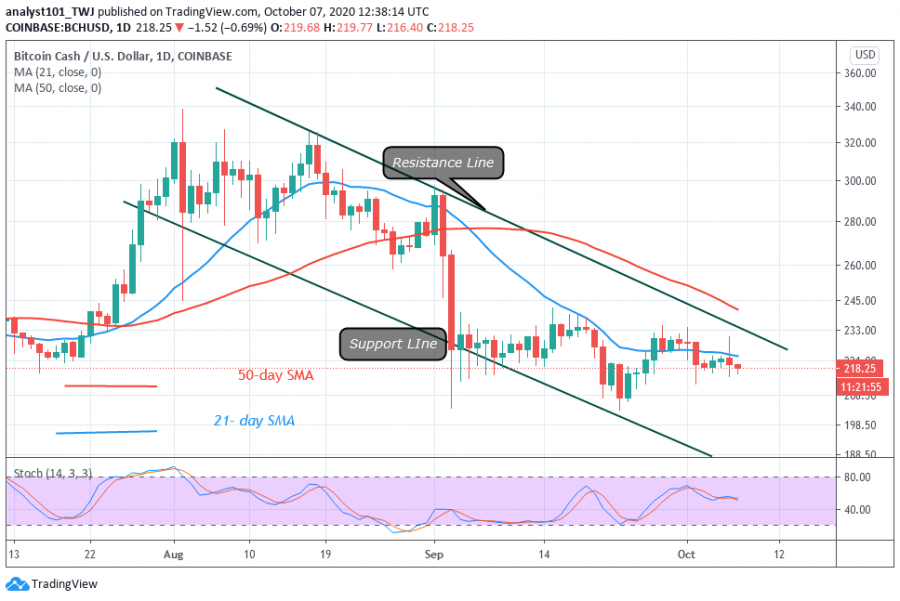
The price was corrected upward but was hindered as it resumed a range bound movement between $215 and $223. The coin is still trading in this tight range as the next direction is uncertain. The coin has shown further downward move as price retests the 21-day SMA. Sellers are on the advantage of pushing prices down as they trade in the bearish trend zone.
Bitcoin Cash indicator reading
BCH price breaks the 21-day SMA but faces rejection at the $233 price level. It is below the 60% range of the daily stochastic. This indicates that the coin has bearish momentum. The stochastic bands are horizontally flat indicating the sideways move.

Key Resistance Zones: $440, $480, $520
Key Support Zones: $200, $160, $120
What is the next move for Bitcoin Cash?
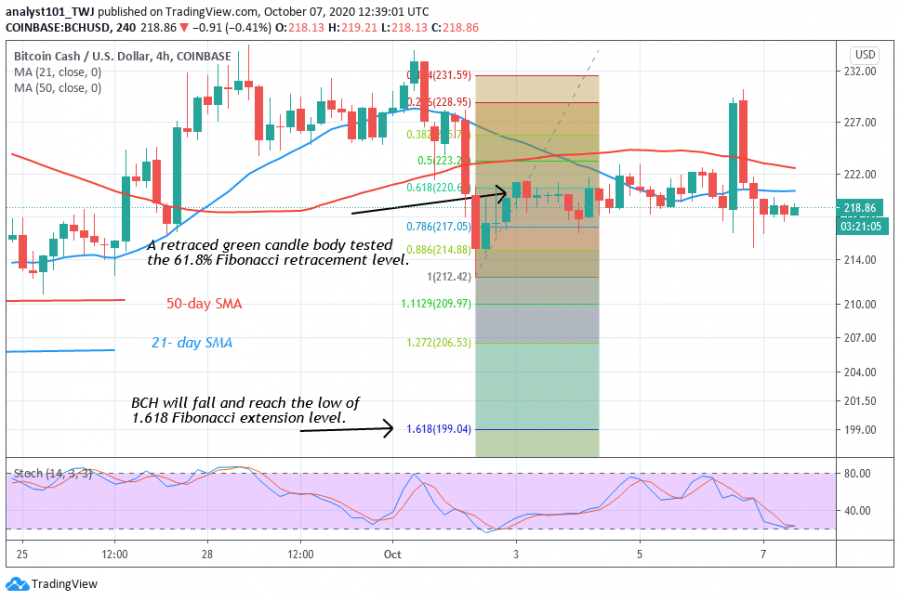
Bitcoin Cash is likely to continue its downward move. This has been confirmed in the last rejection at the $230 high. Meanwhile, in the October 2 downtrend, the retraced candle body tested the 61.8% Fibonacci retracement level. This gives the impression that BCH will decline to the low at 1.618 Fibonacci retracement level.

Disclaimer. This analysis and forecast are the personal opinions of the author that are not a recommendation to buy or sell cryptocurrency and should not be viewed as an endorsement by Coin Idol. Readers should do their own research before investing funds.
News
Price
Price
Price
Price

(0 comments)