Bitcoin Cash Consolidates in Narrow Range, Ready for Possible Breakout or Breakdown

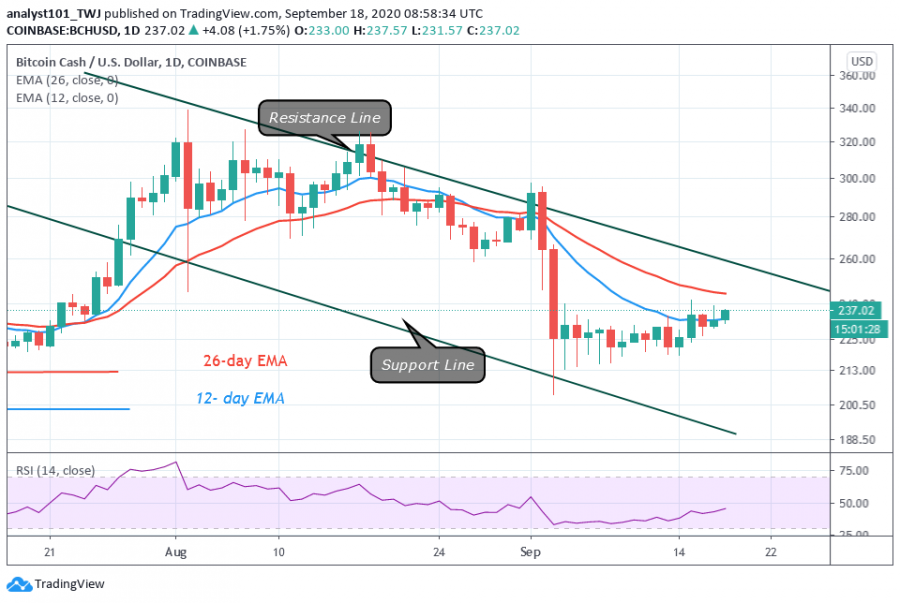
Bitcoin Cash now consolidates in a tight range between $230 and $235. This is because buyers fail to break the $240 resistance twice.
The attempt at the $240 resistance on September 15 resulted in BCH falling to $226 low. Similarly, the coin fell as well to $231 low after a second attempt at the resistance. This indicates that sellers are overwhelming at the $240 high. The crypto now fluctuates in a narrow range.
The recent development can lead to a breakout or breakdown of price movement. Nonetheless, sellers have the advantage over buyers as the price is in the bearish trend zone. The upward move is facing rejection at the 12-day EMA. On the downside, if the bears break the $215 support, the price will find support at the critical support level at $200. However, the selling pressure will continue, when the critical support fails to hold.
Bitcoin Cash indicator reading
BCH is at level 43 of the Relative Strength Index period 14. The RSI is horizontally flat depicting the current range-bound movement of the coin. The crypto tends to fall as it is below the EMAs. The price attempts to break above the EMAs which will propel the coin to rise.

Key Resistance Zones: $440, $480, $520
Key Support Zones: $200, $160, $120
What is the next move for Bitcoin Cash?
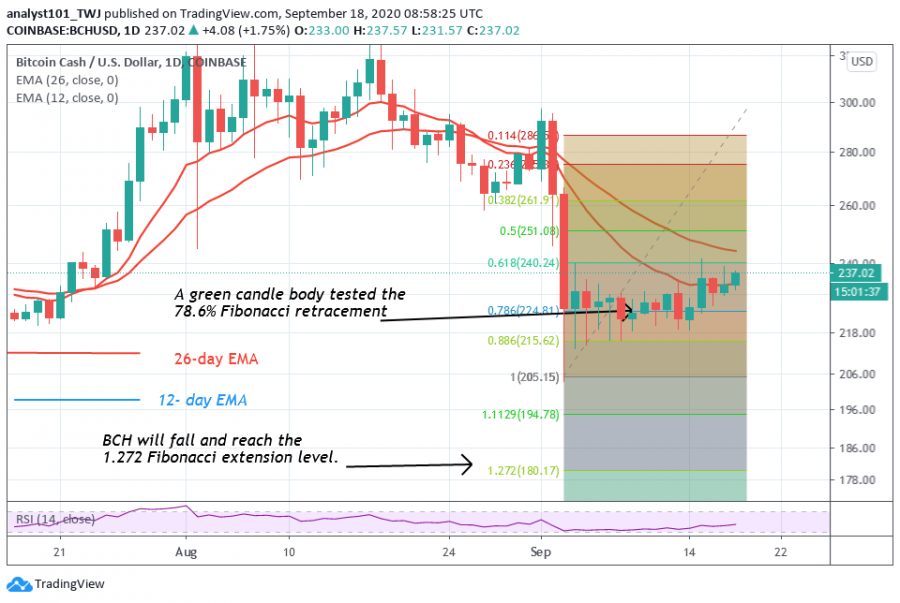
As Bitcoin Cash resumes a narrow range-bound movement between $230 and $235, the chances of a BCH trending is very imminent. A breakdown will be in favour of the Fibonacci tool analysis. This is where the coin will drop to as low as 1.272 Fibonacci extension or $178 low. A breakout above $240 high will signal the resumption of the uptrend.

Disclaimer. This analysis and forecast are the personal opinions of the author that are not a recommendation to buy or sell cryptocurrency and should not be viewed as an endorsement by Coin Idol. Readers should do their own research before investing funds.
Price
Price
Price
Price
Price

(0 comments)