Bitcoin Cash in Downward Correction, Faces Rejection Twice at $640

Bitcoin Cash (BCH) has been in an upward correction for the past three days as the price reached the high of $640. BCH is falling as bulls fail to break the previous lower high of $640.
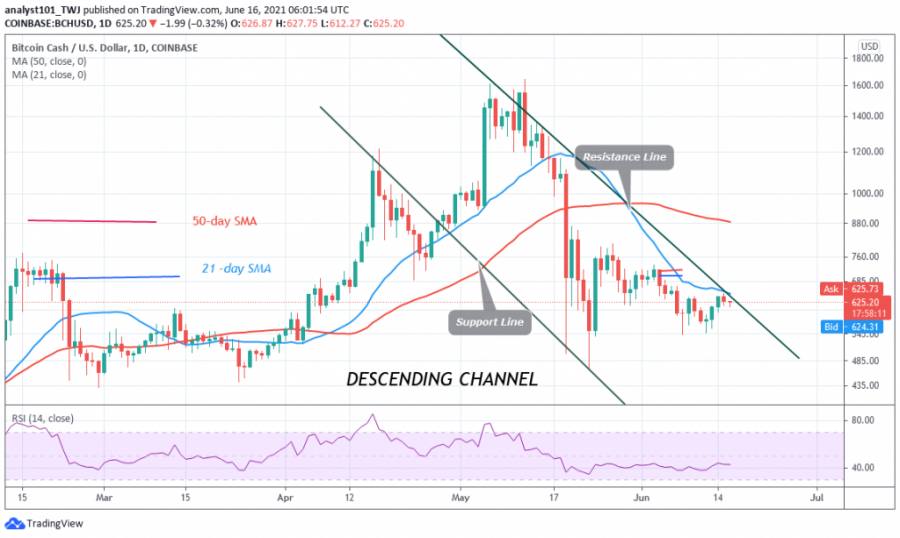
Since May 27, the crypto has been falling as price makes a series of lower highs and lower lows. If buyers breach the $640 resistance, BCH will rally to retest the $760 resistance. The altcoin will be out of downward correction if the $760 high is overcome.
Today, Buyers fail to break the recent high as the crypto resumes a downward move. In the lower time frame, BCH is likely to fall and find support above the moving averages. If it does, the bullish scenario is likely to come into play as indicated above. Conversely, if the price falls and breaks below the moving averages, the crypto will resume the current downtrend. Since May 24, BCH/USD has been in a downward move as buyers fail to sustain the bullish momentum above the $760 high.
Bitcoin Cash indicator reading
Bitcoin Cash is at level 42 of the Relative Strength Index period 14. The altcoin is in the downtrend zone despite the upward correction. BCH is below the 50% range of the daily stochastic. This indicates that the market has bearish momentum. The 21-day and 50-day SMA are sloping downward indicating a downtrend.

Technical indicators:
Major Resistance Levels – $1,800 and $2,000
Major Support Levels – $600 and $400
What is the next move for Bitcoin Cash?
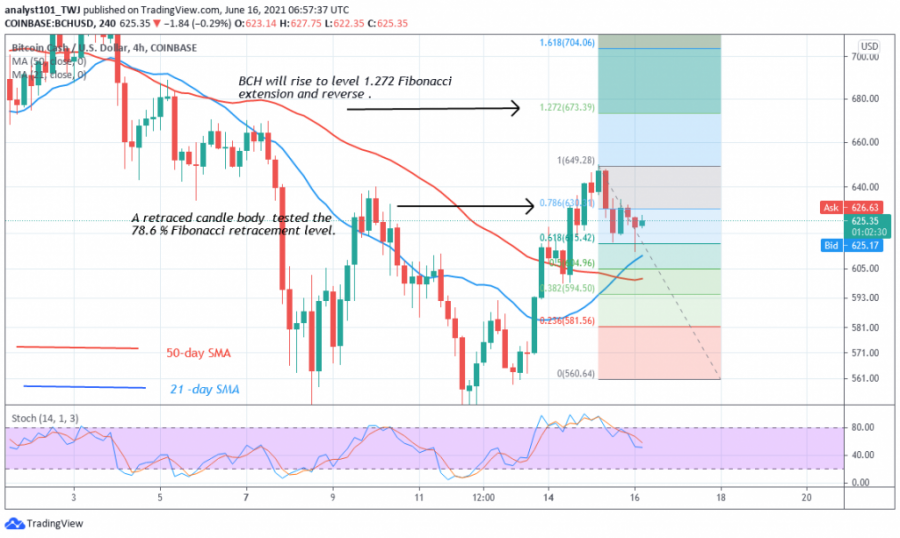
Bitcoin Cash price is correcting upward but faces resistance at $640. The current uptrend will continue if the price finds support above the moving averages. On June 15 uptrend; a retraced candle body tested the 78.6 % Fibonacci retracement level. The retracement indicates that BCH will rise and reverse at level 1.272 Fibonacci extensions or level $673.39. The altcoin is retracing to the 21-day –day SMA support for a possible upward move.

Disclaimer. This analysis and forecast are the personal opinions of the author and are a recommendation to buy or sell cryptocurrency and should not be viewed as an endorsement by Coin Idol. Readers should do their own research before investing funds.
Price
Price
Price
Price
Price

(0 comments)