Bitcoin Cash Retraces to $250 Support as Buyers Recoup to Resume Uptrend

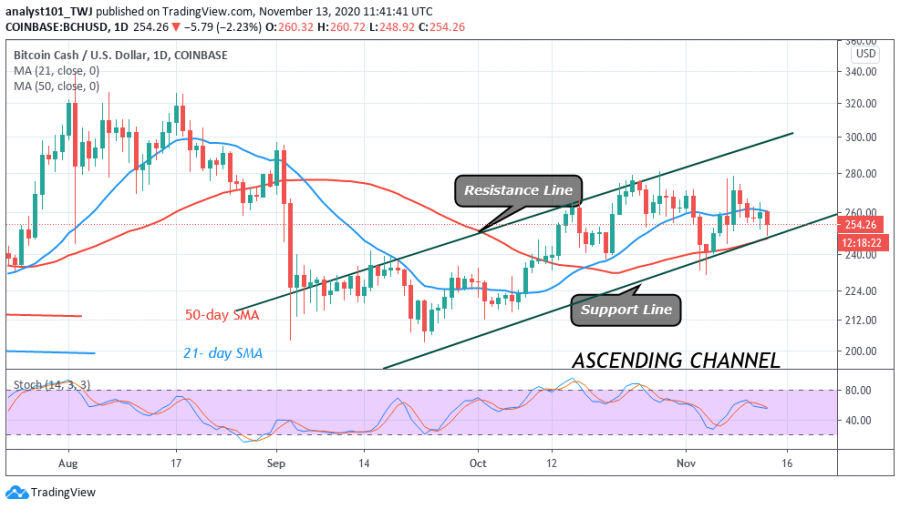
Following its rejection at the $280 high, BCH has been falling consistently on the downside. Nevertheless, on November 10, the coin resumed sideways move after falling to the low at $256.
The crypto was consolidating between $256 and $263 for three days before resuming the downward move. Sellers were in control as they broke the lower price at $256 twice. In the first instance, the bulls recovered as the price pulled back to the range-bound zone.
In the second instance, the price broke below the support level, pulled back to retest the support, and then resume the downward move. The bottom line is that if the current downward move persists, the bears may break below the $250 support level. Incidentally, BCH will decline $216 low. On the other hand, if the $250 support holds, the upside momentum will resume. Today, BCH is trading at $254 at the time of writing.
Bitcoin Cash indicator reading
BCH price has broken below the 21-day SMA and it is approaching the 50-day SMA. A break below the SMAs will mean a further downward movement of the coin. The price bars are also testing the support line of the ascending channel. A break below the support line will mean a resumption of the downtrend.

Key Resistance Zones: $440, $480, $520
Key Support Zones: $200, $160, $120
What is the next move for Bitcoin Cash?
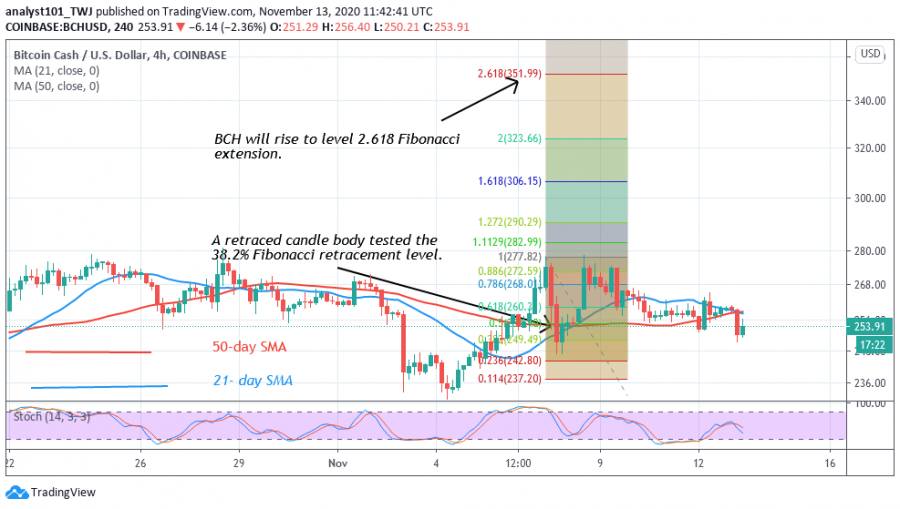
The coin is likely to move to the previous highs above the resistance at $280. In November, buyers have retested the $280 resistance zone thrice. At each attempt at the resistance, BCH will fall to low at $250. Eventually, if buyers are successful, BCH will reach the highs of $300 and $320. Meanwhile, a retraced candle body tested the 38.2% Fibonacci retracement level. This gives us the clue that the coin will rise and reach level 2.618 Fibonacci extensions or the high of $351.99.

Disclaimer. This analysis and forecast are the personal opinions of the author that are not a recommendation to buy or sell cryptocurrency and should not be viewed as an endorsement by Coin Idol. Readers should do their own research before investing funds.
Price
Price
Price
Price
Price

(0 comments)