Ethereum Falls After Losing The $3,700 Breakthrough Support
Updated: Jun 12, 2024 at 15:25

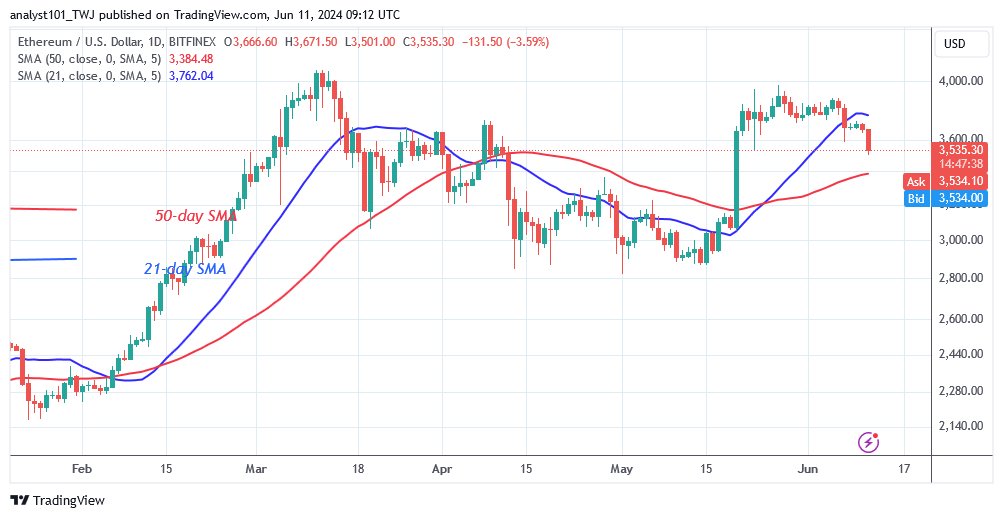
The price of Ethereum (ETH) has breached the 21-day SMA and the support level of $3,700, indicating that selling pressure has resumed.
Long-term analysis of the Ethereum price: bullish
The price of the cryptocurrency retested the $3,700 high before starting to decline. Today, the largest altcoin has fallen to a low of $3,508. The altcoin is expected to fall above the 50-day SMA or the low of around $3,400. If the downtrend breaks the 50-day SMA, the selling pressure will extend to the $3,200 level. The selling pressure will be less if Ether falls and stays above the 50-day SMA. Ether will be forced to move between the 50-day SMA and the 21-day SMA. The value of the altcoin will fluctuate between the moving average lines until the trend resumes. In the meantime, Ether is trapped between the moving average lines.
Analysis of the Ethereum indicators
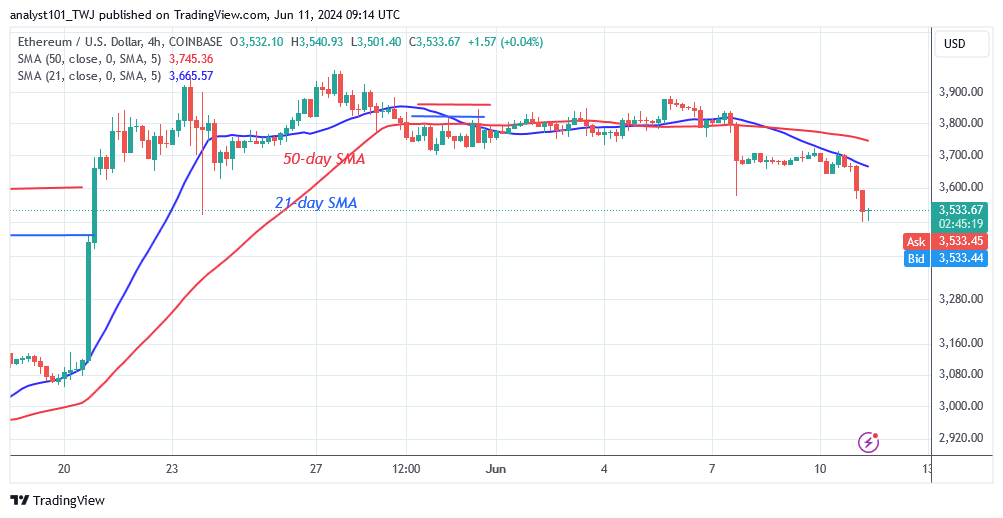
Given the current dip, Ether is trading between the moving average lines and approaching the 50-day SMA support. On the 4-hour chart, doji candlesticks have formed at the $3,700 breakout level. The bears have broken below the $3,700 support and resumed selling pressure.

Technical indicators:
Key resistance levels – $4,000 and $4,500
Key support levels – $3,500 and $3,000
What's next for Ethereum?
Ethereum is bearish as the bullish scenario has been violated. The largest altcoin has lost both the 21-day SMA and the $3,700 breakout support. As a result, Ether is expected to hit the lows of $3,400 and $3,200. Meanwhile, the altcoin has fallen to a low of $3,508 and bears are threatening to short sell.

Disclaimer. This analysis and forecast are the personal opinions of the author and are not a recommendation to buy or sell cryptocurrency and should not be viewed as an endorsement by CoinIdol.com. Readers should do their research before investing in funds.
News
News
Coin expert

(0 comments)