Bitcoin Cash Rallies As It Attempts To Overcome $120 Resistance

Bitcoin Cash (BCH) is in an upward correction and is encountering resistance at $120. The cryptocurrency is bearish as it could hit a low of $110.
Bitcoin Cash Price Long Term Analysis: Bearish
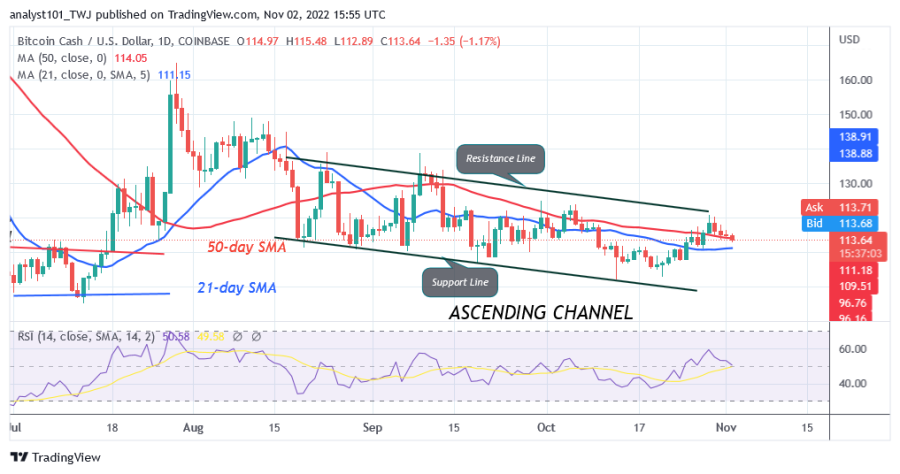
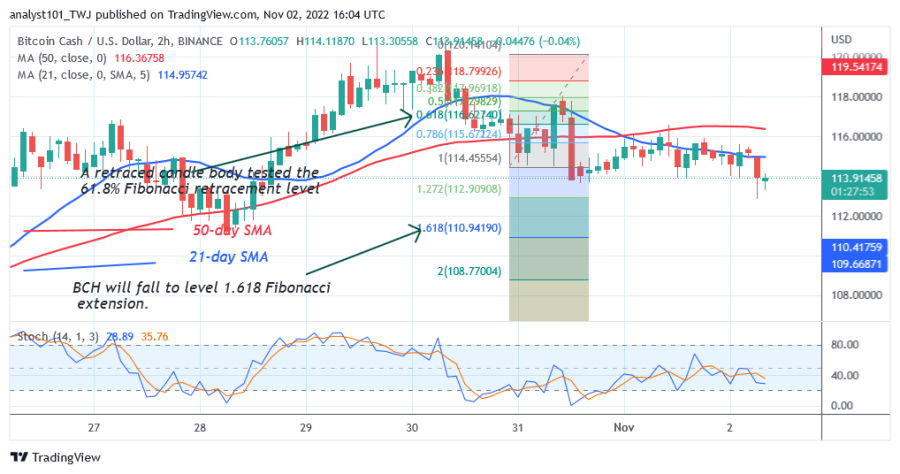
At the time of writing, Bitcoin Cash is above the moving average lines. On the upside, the bullish move will resume when it moves back above the moving average lines. BCH will rise and break through resistance at $20. A break above resistance will catapult BCH to the $140 and $160 highs. On the other hand, if the bears break below the moving average lines, BCH will fall to a low of $110 and later to a low of $101.
Bitcoin Cash Indicator Display
BCH's relative strength index for the 14 period has risen to the 62 level as the altcoin resumes its upward momentum. The price bars are above the moving average lines, indicating a further rise in the cryptocurrency. Bitcoin Cash is above the 75% area of the daily stochastic. The cryptocurrency is in a bullish momentum and is approaching the overbought area of the market.
Technical Indicators
Key Resistance Zones: $160, $180, $200
Key Support Zones: $120, $100, $80

What is the next direction for BCH/USD?
The bearish scenario of BCH has been invalidated as the price has risen above the $114 support. The price recovery has reached a high of $120. The cryptocurrency will come out of a downward correction if the price breaks the resistance at $120 and the bullish momentum is maintained. On the other hand, the altcoin will fall below the moving average lines if it fails to break the recent high.

Disclaimer. This analysis and forecast are the personal opinions of the author and are not a recommendation to buy or sell cryptocurrency and should not be viewed as an endorsement by Coin Idol. Readers should do their own research before investing in funds.
News
Price
Price
News
Coin expert

(0 comments)