Binance Coin Recovers On The Way To Its Previous High Of $340

The price of Binance (BNB) coin is rising as it surpasses the 21-day SMA. BNB price analysis.
Long-term forecast for BNB price: bullish
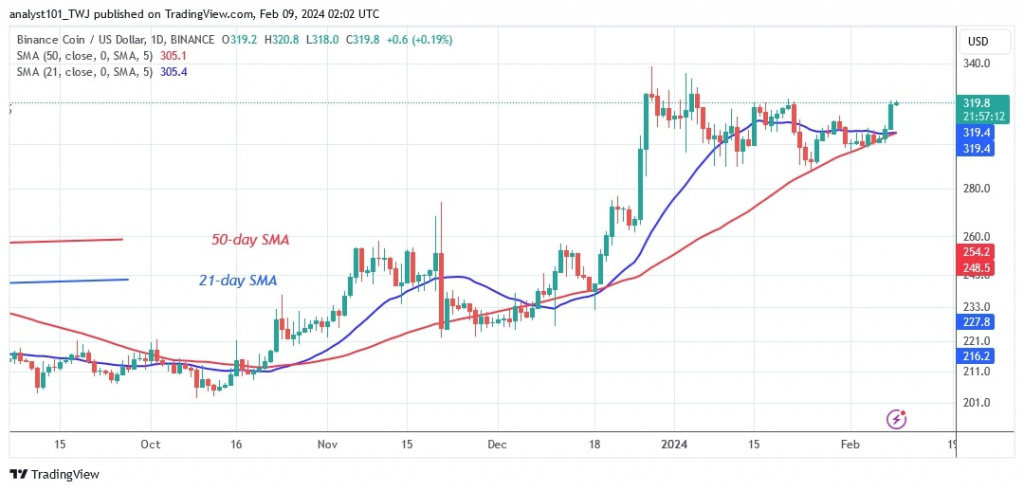
Binance Coin has regained upward momentum after two weeks of being trapped between the moving average lines. The altcoin reached a high of $320 at the time of writing. The cryptocurrency has reached its historical price level of January 15, 2024. Buyers have not been able to break above the most recent price level of December 27, 2023.
If the bulls break through the $320 barrier, the market will rise to a high of $340 or $352. BNB, on the other hand, will be forced to trade sideways if buyers fail to sustain their bullish momentum above the recent high. BNB will trade above the moving averages but below the $320 high. Meanwhile, the altcoin has gradually risen above its previous high of $320.
BNB indicator reading
Following the recent market rally, the price bars are now above the moving average lines. BNB is now returning to its previous highs. The moving average lines continue to slope horizontally after the market recovery. The rally has overshadowed the doji candlesticks which have slowed the price action.
Technical indicators:
Key resistance levels – $300, $350, $400
Key support levels – $200, $150, $100

What is the next direction for BNB/USD?
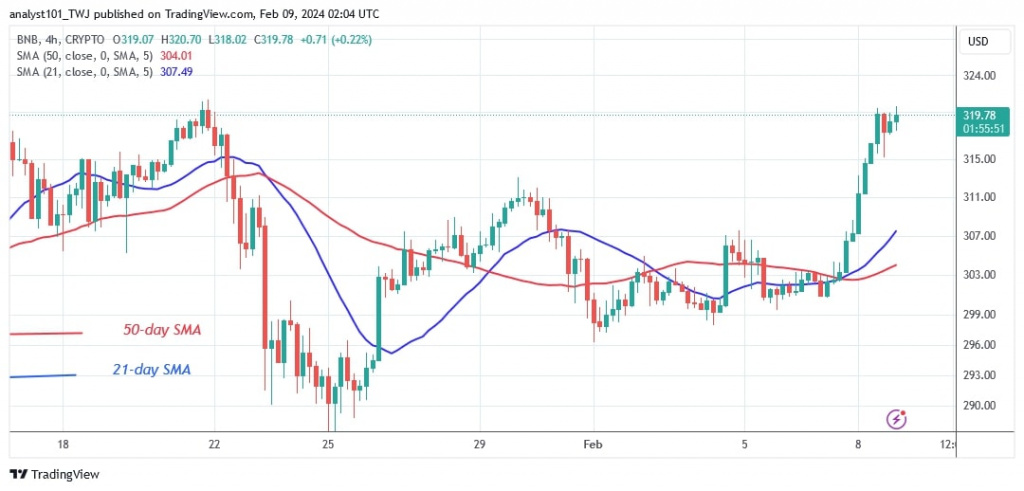
On the 4-hour chart, BNB has resumed its bullish momentum and has risen above the moving average lines. The altcoin has reached its previous high of $320. Buyers are hoping to surpass the previous high of $338.

Disclaimer. This analysis and forecast are the personal opinions of the author and are not a recommendation to buy or sell cryptocurrency and should not be viewed as an endorsement by CoinIdol.com. Readers should do their research before investing in funds.
Price
Price
Price
News
Price

(0 comments)