Bitcoin, ETH & XRP: Is the Bearish Trend Actually Ending?
Updated: Jul 19, 2020 at 21:00

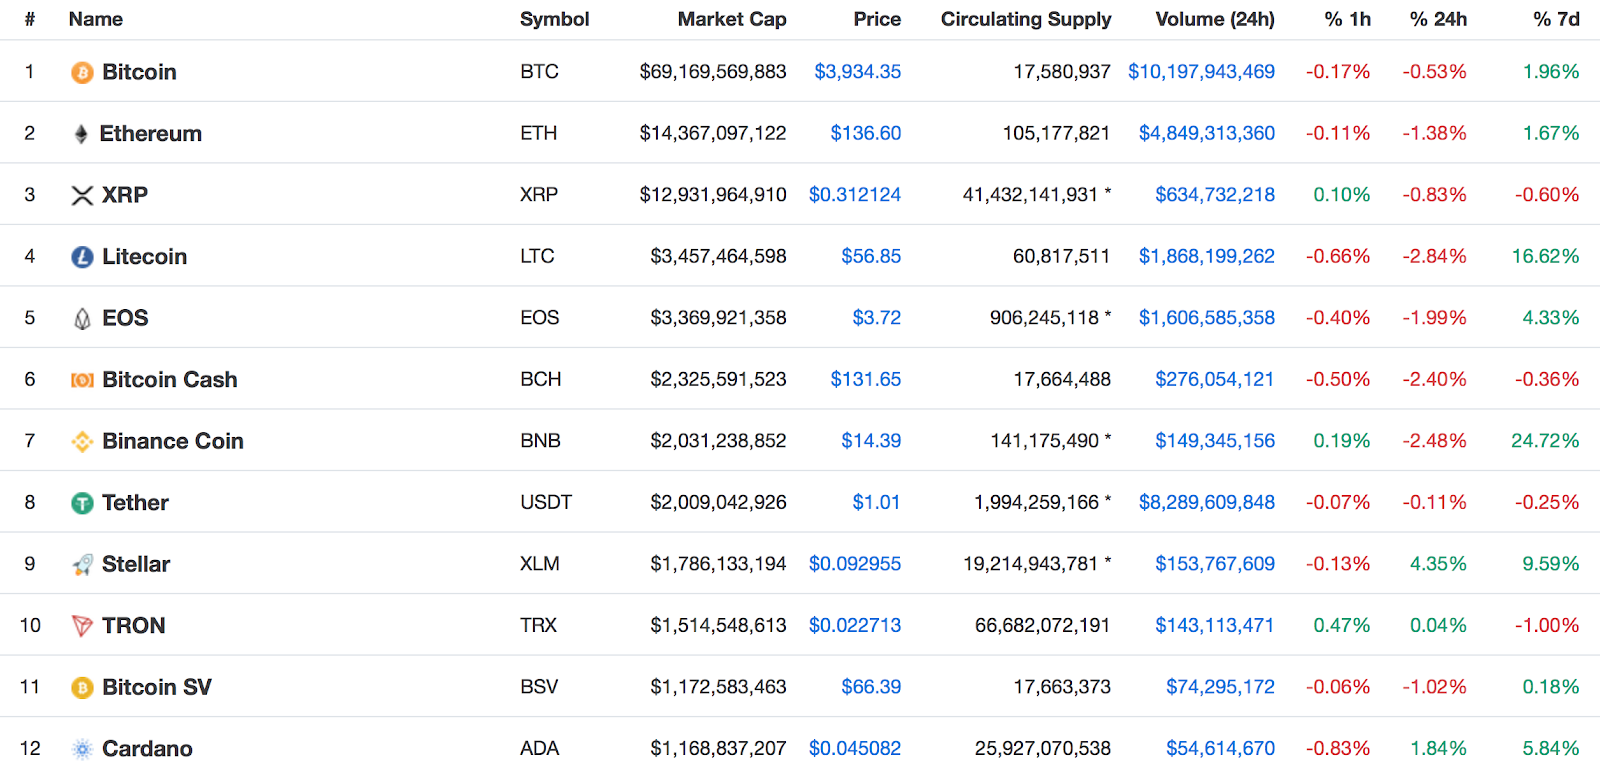
Bitcoin (BTC) is accumulating profits after a significant surge in value on Tuesday, March 5. The flagship crypto hit around $3,900 resistance, but the positive impetus bleached during hypothetical standing on the crypto market. Bitcoin is currently trading at around $3,934 (-0.53% 24h and 1.96% 7d) price, with a market cap (MC) of more than $69.169 billion.
BTC/USD 24h
Bitcoin (BTC/USD) is now soaring to a point of interest at the middle of its range on the 60-minutes time frame, still determining whether to rebound to the top or go back to support.
Litecoin is currently trading at $56.85 (-2.84% 24h and 16.62% 7d), EOS is changing hands at $3.72 (-1.99 percent 24-hour and 4.33% 7-day). Binance Coin (BNB) is still trading like a hot cake at $14.39 (-2.48% 24-hour and 24.72 percent 7-day) with a market cap of $2.031 billion. BNB is now in the 7th Rank by MC on coinmarketcap. It has just surpassed Tether which is trading at $1.01 (-0.07 percent 1-hour, -0.11 percent 24-hour and -0.25 percent 7-day).
A major resistance point is seen right above the latest price. It is being formed by a confluence of technical
indicators such as 38.2 percent Fibo retracement daily, weekly & monthly.
The subsequent positive barrier is spotted at psychological $4,000 which has Fibo 23.6 percent monthly and the around 61.8 percent Fibo retracement weekly found slightly above this point.
The downward trend shows that the initial support level falls below the latest price, which is being made by a confluence of technical indicators such as SMA100, SMA5 4-hour and Fibo retracement 61.8 percent daily.
Applying UTXO’s to Study Long Term Bitcoin Price Cycles
Studying BTC’s aggregate UTXO (unspent output from bitcoin transactions) age distribution over a given period of time gives perception into the purchasing and selling patterns of preceding market cycles. This enables us to predict where we are in relation to prior cycles and what we can possibly expect going forward.
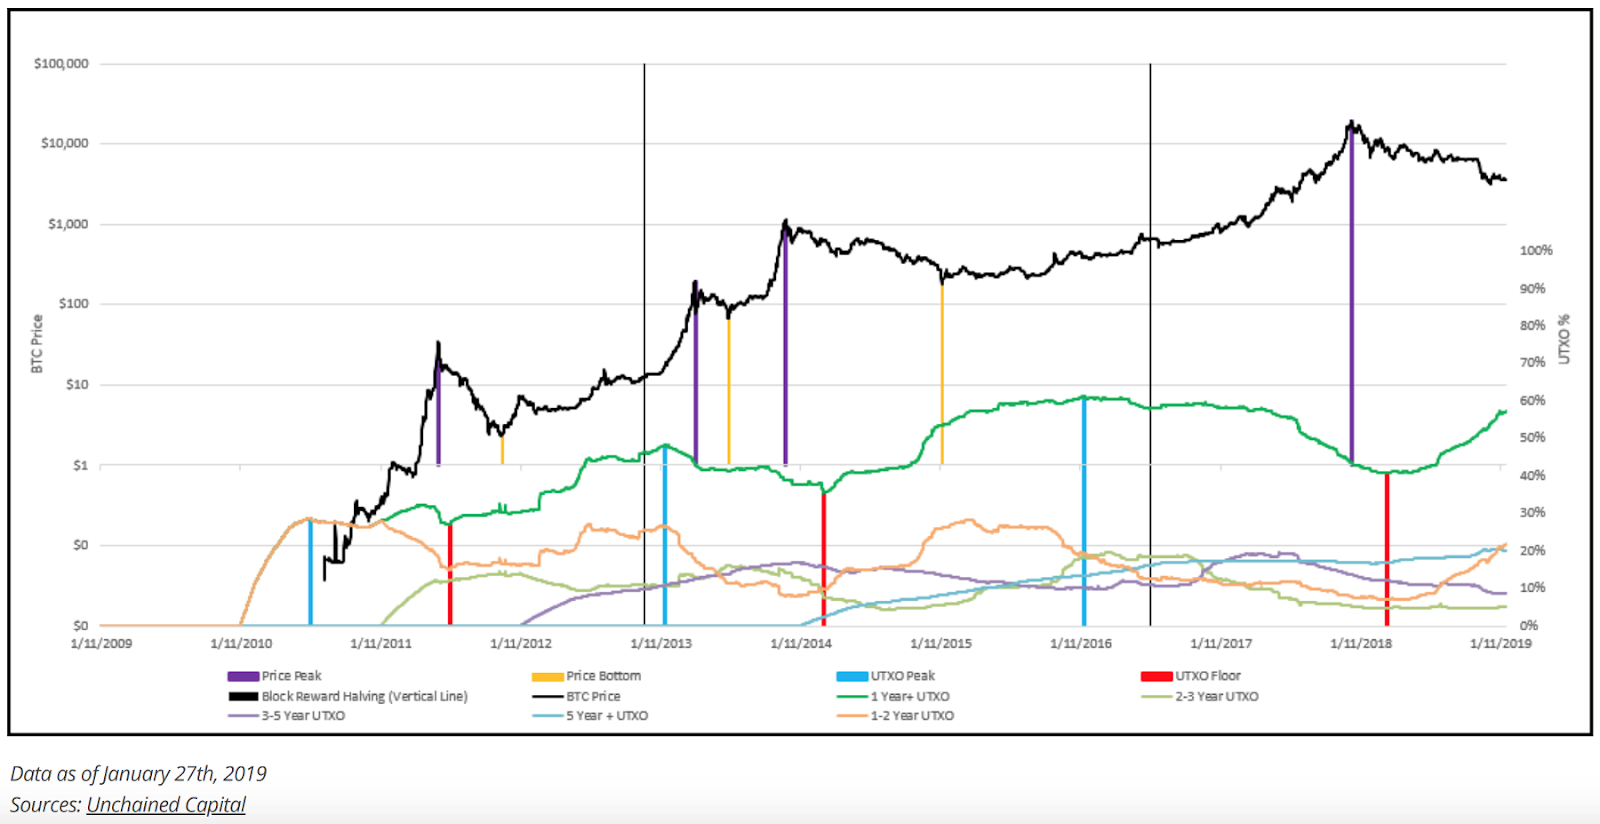
A low number of 1+ year UTXO’s shows that loads of Bitcoin have been moving within the last year. There are few addresses which have been holding for more than one year. If you have a look at the far end of the Q1 (first quarter) of 2018 you can clearly see a low was made in UTXO’s just like the crypto community did near the commencement of 2014/2015 bear market. The only reason for this event is that long term holders are very smart.
As you can see several people who had been holding Bitcoin for more than 12 months begun selling BTC from when the crypto broke over 10,000 and continued selling throughout the end of the Q1 of last year.
All together cryptocurrency traders which lately begun investing in Bitcoin between October 2017 to January 2018 only actually resumed selling after the price dropped, with a significant boom in selling about the 6,000 level and also on the plunge between 6,000 and 3,000 suffering huge losses.
What Does this Curve Mean?
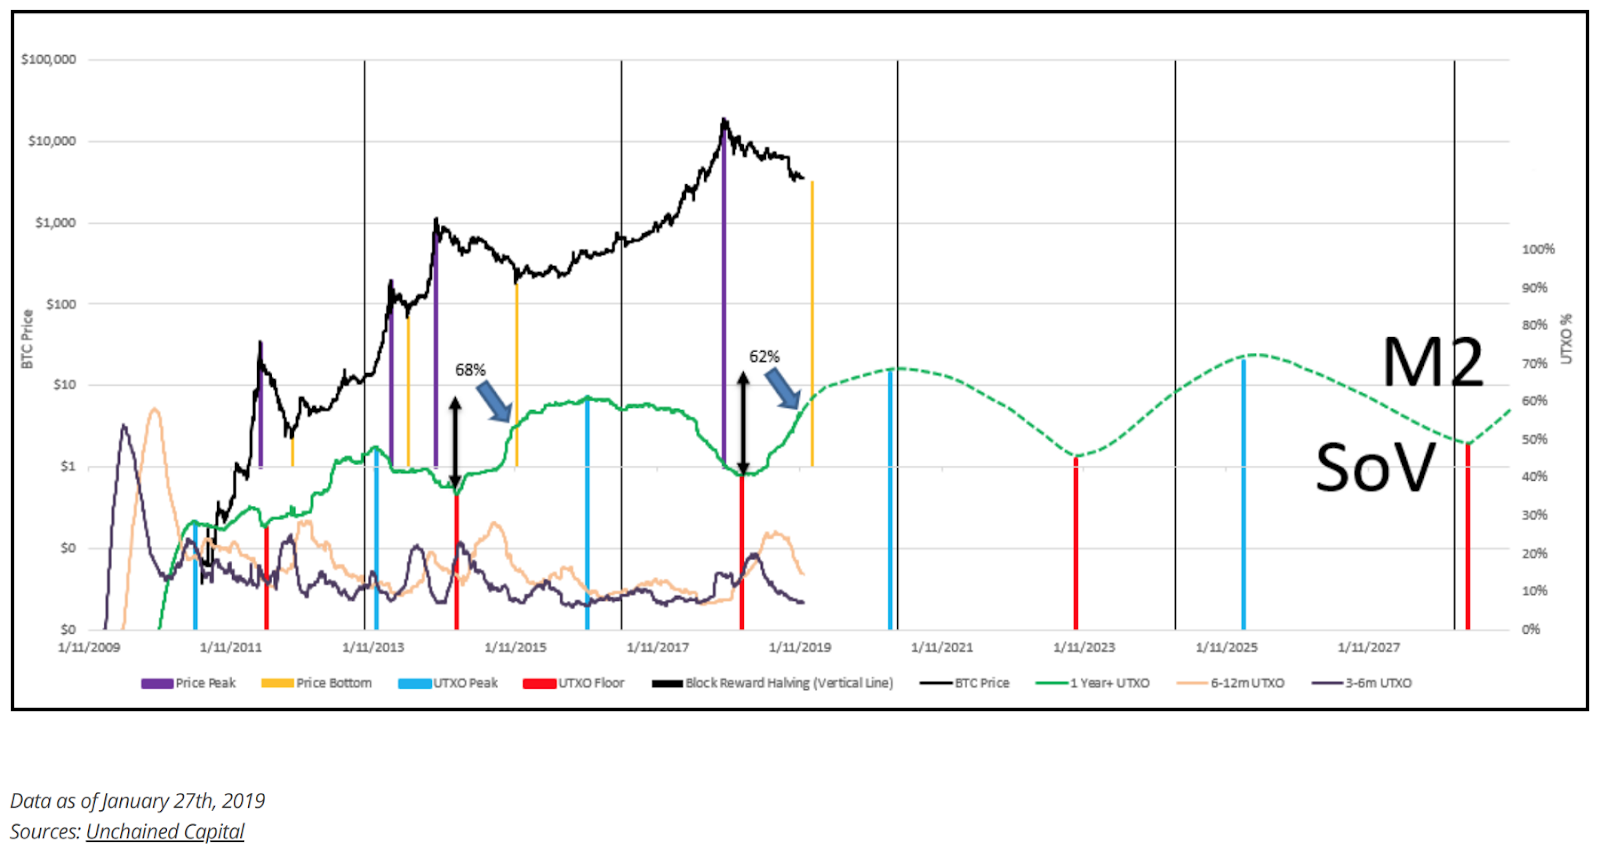
“It means that long term buyers started buying from Q2 2018 after selling out between October 2017 — March 2018.”
“For some additional context, the price bottom from the previous cycle occurred 68 percent of the way up from the 1-year holder bottom to the holder top. We’re currently 62 percent of the way to the forecasted holder top”. — Delphi Digital.
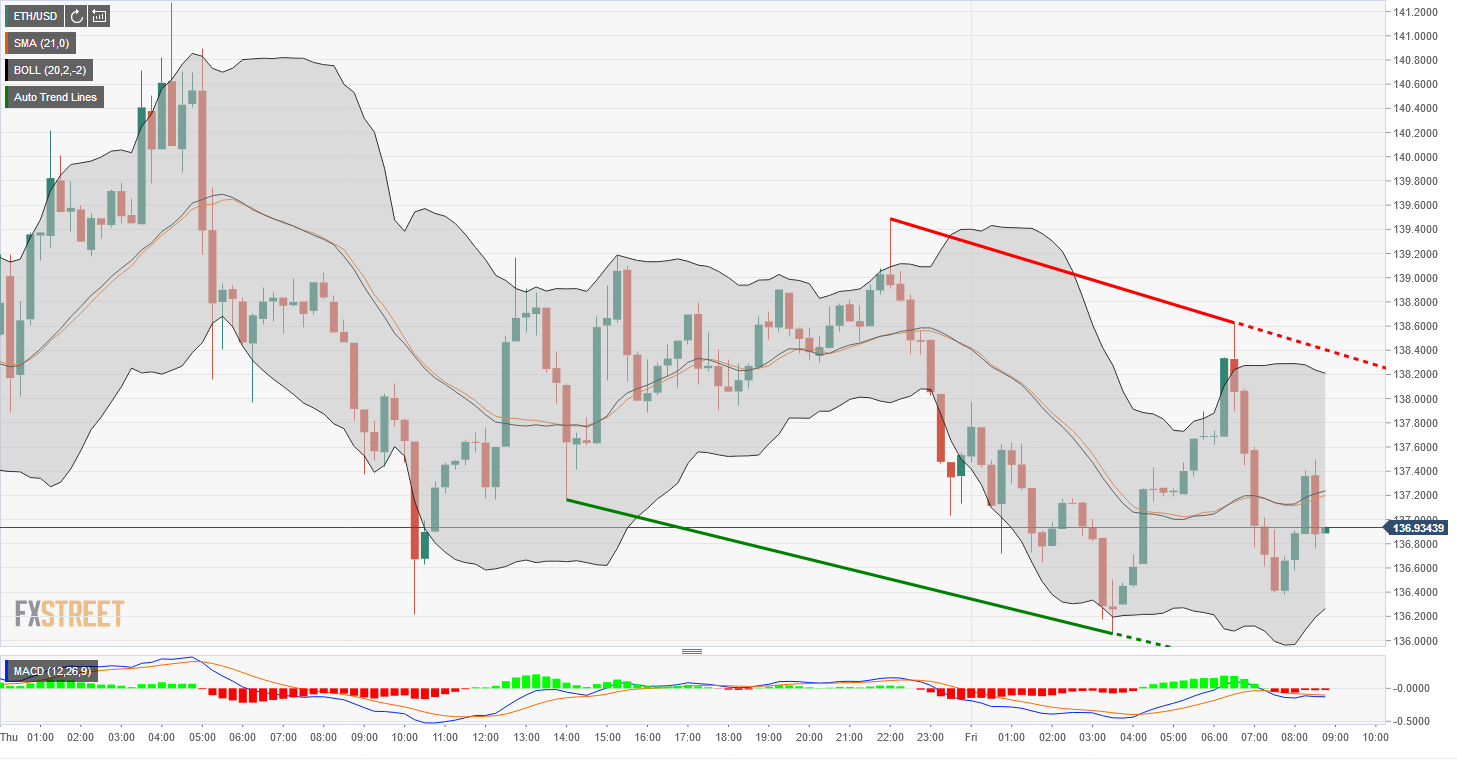
ETH/USD 24h
ETH/USD is changing hands at $136.60 (with an MC of over $14.367), at press time, which is below the SMA100 ($140.5 level), just above the first resistance price. The second resistance price is at $142.5, and the third resistance level is around $150.5.
Below the latest Ethereum (ETH) price, the first support level s at $134.9, the second support level is around $130.5 and the third support level is at around $127.7.
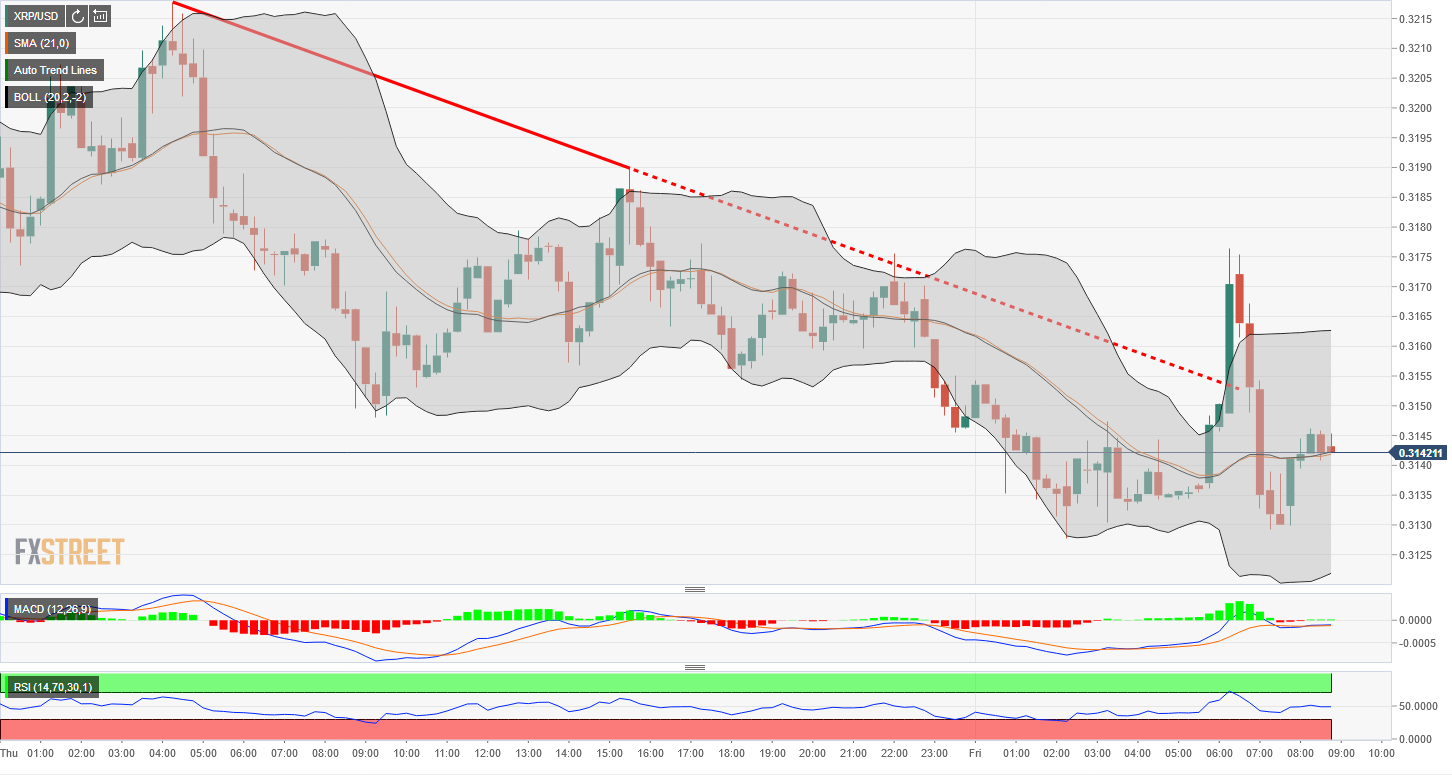
XRP/USD 24h
Currently, Ripple trades at $0.312082 (with an MC of over $12.930), which is slightly above the supporting level EMA50. It is clear that the first resistance level is seen at $0.317 (SMA100), the second resistance level is seen at $0.328 and the third at $0.334.
On the downside, the first support price is at around $0.315 which in this case is EMA50, the second support price is at SMA200 ($0.311) and then the third support is at $0.305.
The 4-hour DMI is completely out of formation, and it is impossible to do an appropriate analysis.
Many analysts have been low in BTC to date, expecting that the surprise in institutional interest encouraged by the establishment of Fidelity’s platform could reinforce prices higher.
The recent rally in Bitcoin has been pinned by many on the positive surge in Litecoin, which is having a significant effect on the entire cryptocurrency industry.
News
News
News
News
Politics

(0 comments)