Bitcoin Cash Falls Below $480 High, Lacks Buyers at Higher Price Levels

The price of Bitcoin Cash (BCH) remains in a downward correction. Since December 14, the market has corrected to the upside.
Bitcoin Cash Price Long Term Analysis: Bearish
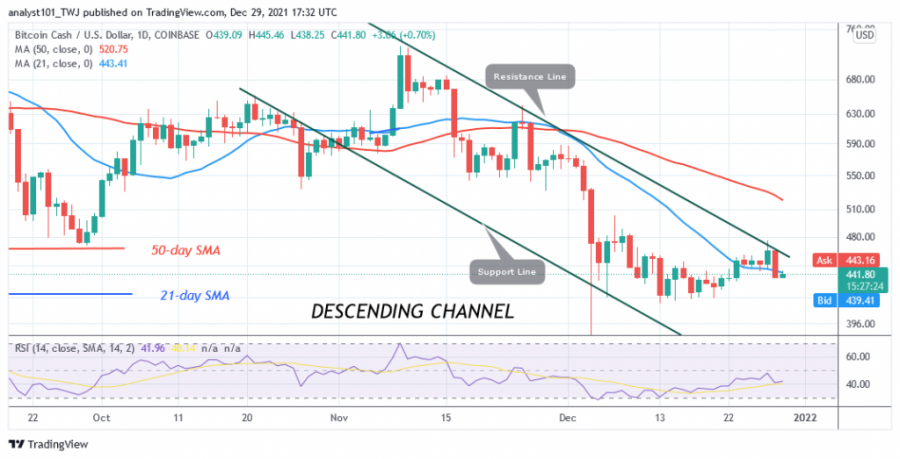
On December 29, Bitcoin Cash has taken a bullish momentum and broken the 21-day moving average line, but is encountering resistance at the $480 high. BCH has fallen below the moving averages after rejecting them at the recent high.
Today, buyers are trying to push the altcoin higher. The bulls have a difficult task ahead of them to push the altcoin higher. In order to regain bullish momentum, buyers need to break above the 21-day moving average line and resistance at $480. Bitcoin Cash is out of the downward correction if buyers push BCH above the $550 high. Meanwhile, BCH is trading at $442.75 as of press time. Nonetheless, the cryptocurrency is approaching the bullish trend zone.
Bitcoin Cash Indicator Display
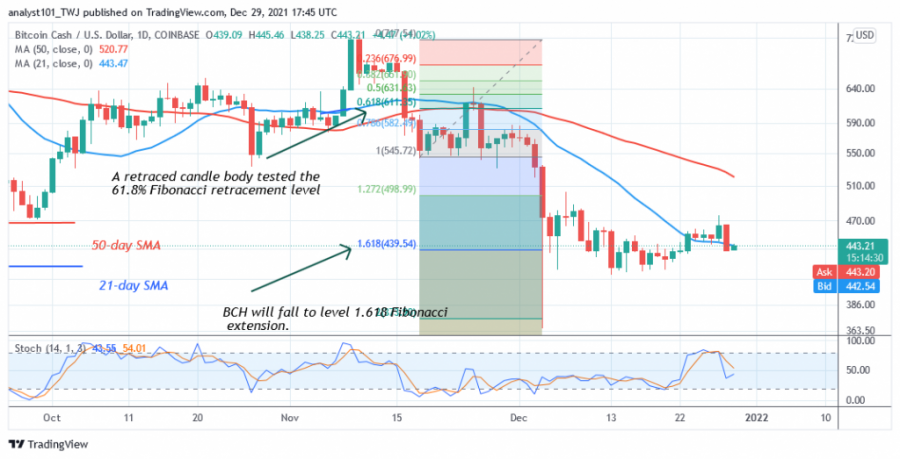
BCH is at level 42 on the Relative Strength Index for period 14, indicating that the altcoin is in the downtrend zone and below the 50 midline. The price bars are below the moving averages of the 21-day and 50-day lines, indicating further downward movement. BCH is above the 40% area of the daily stochastics. The market has resumed its bullish momentum.

Technical Indicators
Key resistance zones: $800, $820, $840
Key support zones: $500, $480, $460
What is the next move for Bitcoin Cash (BCH)?
Bitcoin Cash has resumed a downward correction after the recent decline. Bulls are responding to the recent decline by making upside moves. Meanwhile, the downtrend from November 18; a retraced candle has tested the 61.8% Fibonacci retracement level. This retracement suggests that BCH will fall to the Fibonacci extension level of 1.618 or $439.54. Price action shows that BCH has retested the Fibonacci level and resumed consolidation above it.

Disclaimer. This analysis and forecast are the personal opinions of the author are not a recommendation to buy or sell cryptocurrency and should not be viewed as an endorsement by Coin Idol. Readers should do their own research before investing funds.
Price
Price
News
Price
Price

(0 comments)