TRON Slips But Recovers Above The $0.124 Support Level

The price of TRON (TRX) is currently moving above the moving average lines after reaching resistance at $0.128. Price analysis by Coinidol.com.
Long-term forecast for the TRON price: bullish
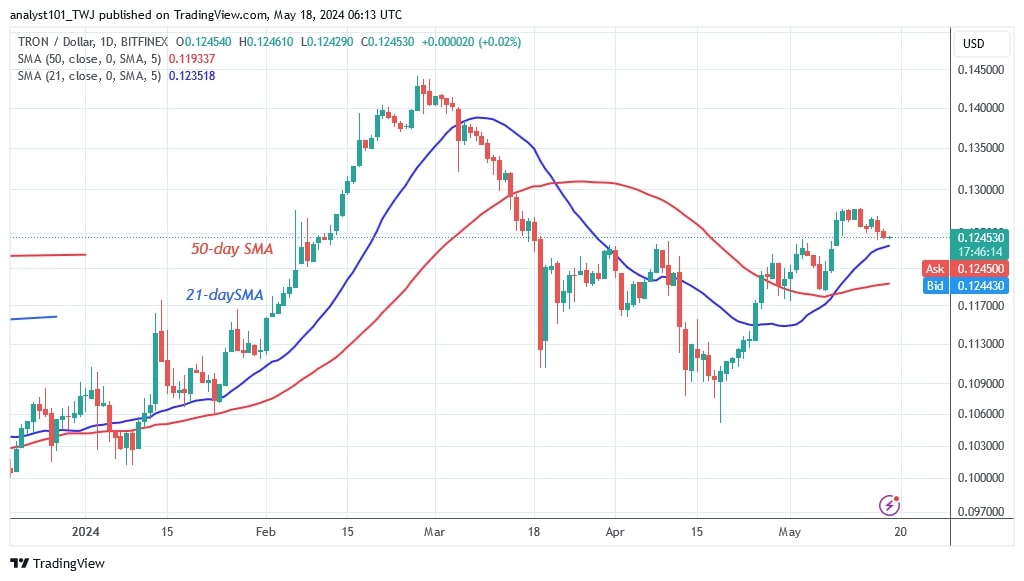
Since April 19, the price of TRON has risen, making higher highs and lower lows along the way. The current rise is expected to reach its highs of $0.135 and $0.14, although the altcoin has retreated above the moving average lines.
Currently, TRON is hovering above the 21-day SMA support. The current rise will continue if it retraces above the 21-day SMA. However, if the bears break below the 21-day SMA support, the current uptrend will come to an end. The altcoin will lose value and fall to a low of $0.115 to $0.11. Currently, the altcoin is trading just above the 21-day SMA support. At the time of writing, TRON is worth $0.124.
TRON indicator reading
The altcoin is bearish, although the price bars are still above the moving average lines. The uptrend will continue if the bulls hold the 21-day SMA support. The current rise is represented by the moving average lines sloping upwards. The moving average lines form a bullish intersection when the 21-day SMA crosses above the 50-day SMA, which is a bullish sign.
Technical indicators
Key supply zones: $0.09, $0.10, $0.11
Key demand zones: $0.06, $0.05, $0.04

What is TRON's next move?
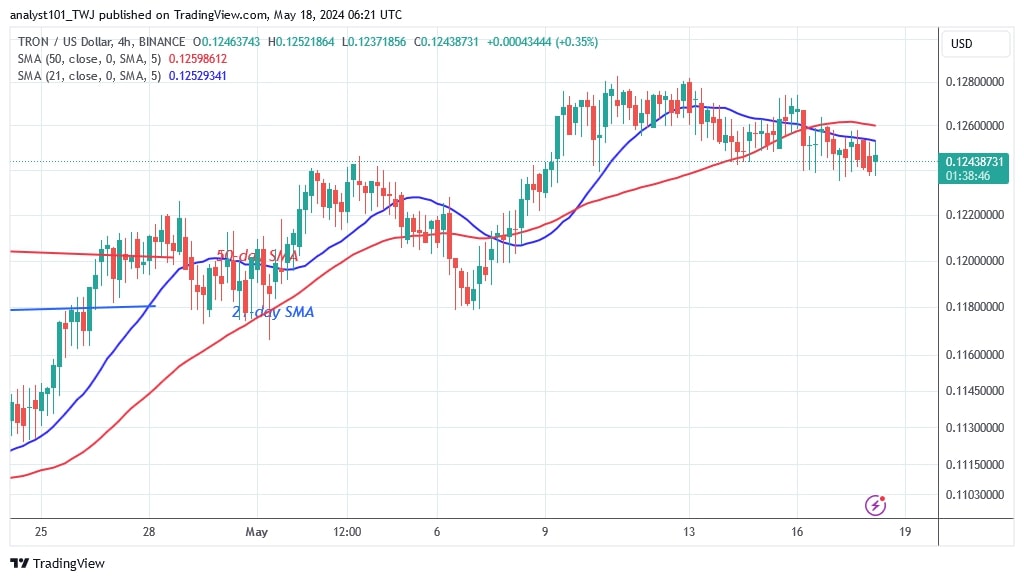
On the 4-hour chart, TRON is moving sideways below the $0.128 resistance level. The recent upswing was halted as the altcoin fell below the moving average lines. The altcoin has fallen above its breakout price of $0.124. TRON will rise if the breakout level holds. If the support at $0.124 is broken, selling pressure will increase.
Last week Coinidol.com reported that thecryptocurrency hit a first obstacle at a high of $0.124.

Disclaimer. This analysis and forecast are the personal opinions of the author and are not a recommendation to buy or sell cryptocurrency and should not be viewed as an endorsement by CoinIdol.com. Readers should do their research before investing in funds.
Price
Price
News
Price
Price

(0 comments)