Weekly Cryptocurrency Market Analysis: Altcoins Trade In A Range, After A Recent Slump
Updated: Feb 13, 2023 at 11:26

As cryptocurrency stocks get caught in a range between the moving average lines, they are currently being rejected at their respective overhead resistance levels.
As long as the moving average lines are intact, the altcoins will continue to trade in a range. We will take a closer look at a few of these cryptocurrencies.
Optimism
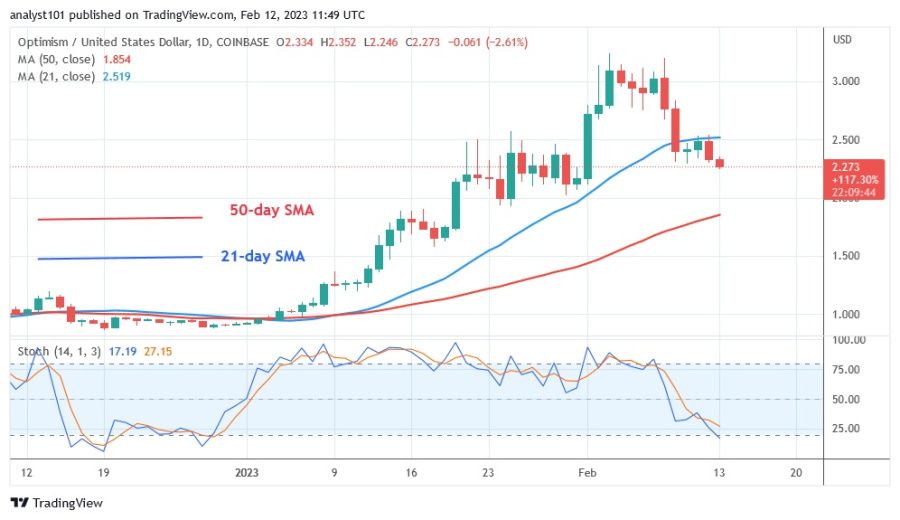
Optimism (OP) is down as it faces rejection at the high of $3.24. After retesting the resistance zone twice, the cryptocurrency value has fallen. The price of the cryptocurrency is above the 50-day line SMA, but below the 21-day line SMA. The closer it gets to the 50-day line SMA, the more it falls OP. On the downside, the altcoin will be forced to move in a range between the moving average lines if the price falls and stays above the 50-day line SMA. On the other hand, if the price falls below the 50-day line SMA, the downtrend would resume. Below the stochastic level of 25 on the daily basis OP is in a negative momentum. The altcoin performed the worst this week. It has the following characteristics:
Current price: $2.28
Market capitalization: $9,720,616,331
Trading volume: $240,030,050
7-day gain/loss: 23.50%
Fantom
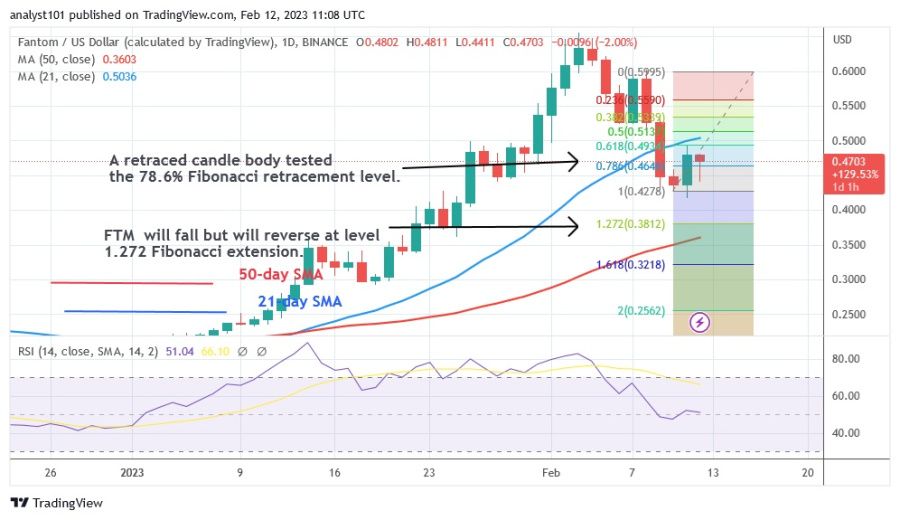
Fantom (FTM) is currently in a downtrend as the price fell below the 21-day line SMA. The altcoin dropped to $0.42 before recovering. Since February 3, the uptrend has stalled at an overbought level of $0.65. FTM is above the 50-day line SMA, but below the 21-day line SMA. Being trapped between the moving average lines, the altcoin is expected to continue its movement within the trading range. Fibonacci tool analysis predicts that FTM will decline but turn around the level of 1.272 Fibonacci extension or $0.38. The Relative Strength Index for the 14 period is at 75. The alternative coin is overbought and could fall. It has the following characteristics and is the second worst performing cryptocurrency:
Current price: $0.4659
Market capitalization: $1,479,167,552
Trading volume: $400,943,448
7-day gains/loss: 22.32%
Aptos
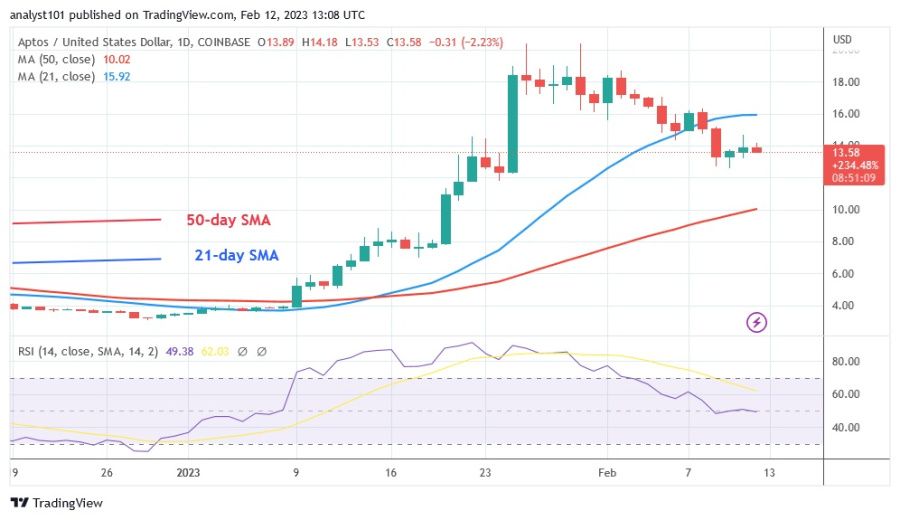
The price of Aptos (APT) has dropped below its 21-day moving average. The alternative currency hit a low of $12.58. While it is trading above the 50-day line SMA, it is trading below the 21-day line SMA. The altcoin rose to a high of $20 during the previous price action. When the cryptocurrency value approached the overbought area of the market, it was stopped. The moving average lines are now surrounding Aptos. When the moving average lines are crossed, the altcoin will trend. According to the Relative Strength Index for the 14 period, Aptos is currently at the 49 level, indicating that supply and demand are in balance. Below is a description of APT, the third worst performing cryptocurrency.
Current price: $13.77
Market capitalization: $13.947.300.784
Trading volume: $474,799,818
7-day gain/loss: 14.29%
EthereumPoW
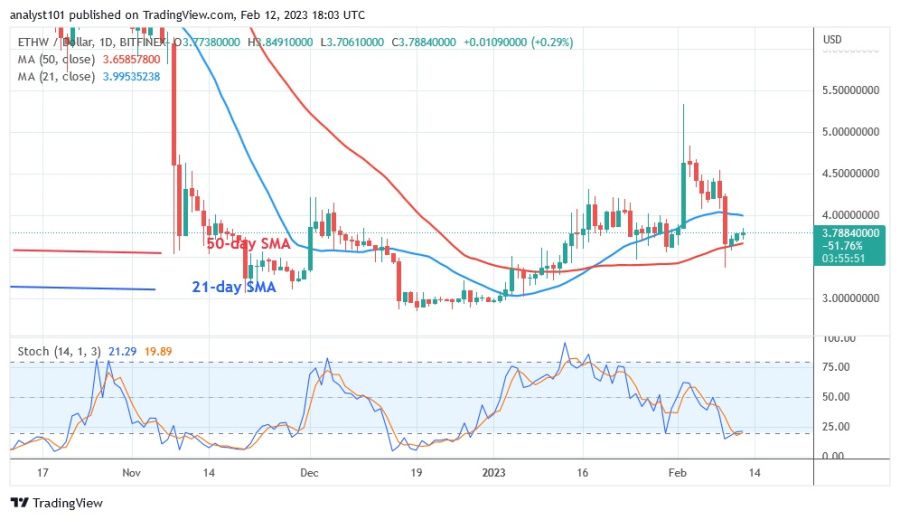
EthereumPoW (ETHW) is currently in a sideways trend as it has slipped below the 21-day line SMA. While it is trading between the moving average lines, the alternative currency is above the 50-day line SMA. As long as the cryptocurrency holds above the current support or the 50-day line SMA, it will be forced to move in a range.
If buyers manage to keep the price above the 21-day line SMA, the altcoin will resume its uptrend. The altcoin is currently trading below the 20 level of the daily stochastic. This indicates that the oversold area of the market has been reached. When prices rise, buyers will tend to the lower price points. ETHW is the fourth worst performing coin. The cryptocurrency's attributes include:
Current price: $3.70
Market capitalization: $400,996,605
Trading volume: $10,742,329
7-day gain/loss: 13.63%
Solana
The price of Solana (SOL) has fallen below the 21-day line SMA. The current uptrend has ended since January 14, as buyers failed to maintain positive momentum above the $26 level. On February 5, the alternative currency crossed the 50-day line SMA, after falling below the 21-day moving average line. Solana fluctuates between the moving average lines. The price of the coin moves when the moving average lines cross. In other words, the price of the altcoin has fallen to a range between $20 and $26. If the coin breaks above the 21-day line SMA, the positive momentum will resume. If the $20 support is breached, Solana will fall much more. The coin with the fifth worst performance is Solana. It has the following characteristics:
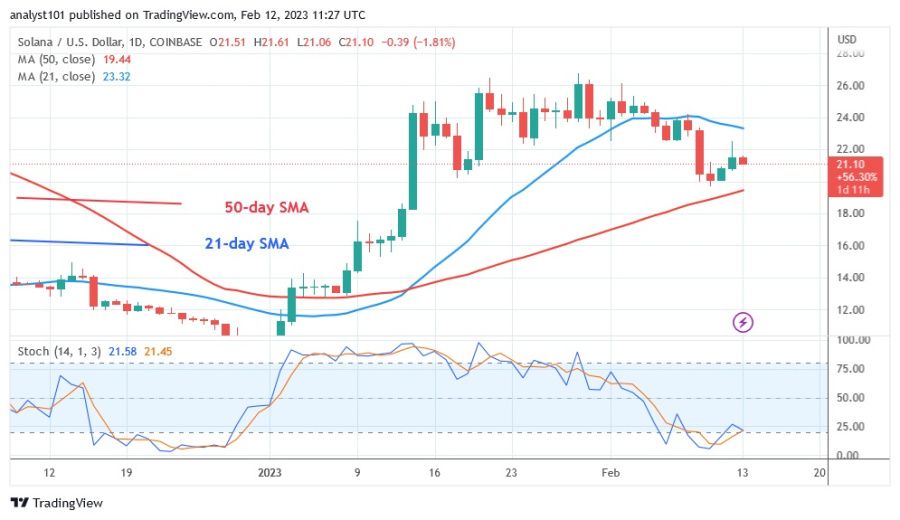
Current price: $21.11
Market capitalization: $11.543.286.948
Trading volume: $559,484,532
7-day gain/loss: 13.01
Disclaimer. This analysis and forecast are the personal opinions of the author and are not a recommendation to buy or sell cryptocurrency and should not be viewed as an endorsement by CoinIdol. Readers should do their research before investing in funds.
Price
Price
Price
Price
News

(0 comments)