Weekly Cryptocurrency Market Analysis: Altcoins Make Strong Recovery as Bulls Breach More Resistance Levels
Updated: Mar 29, 2022 at 10:45

After Bitcoin broke through overriding resistance at $45,000, the five altcoins have rallied into the overbought regions of the market.
The altcoins will maintain their recent gains if buyers keep the price above the moving averages. Further upside is likely as long as the altcoins remain above the moving averages. Let us examine each of these coins.
Zilliqa
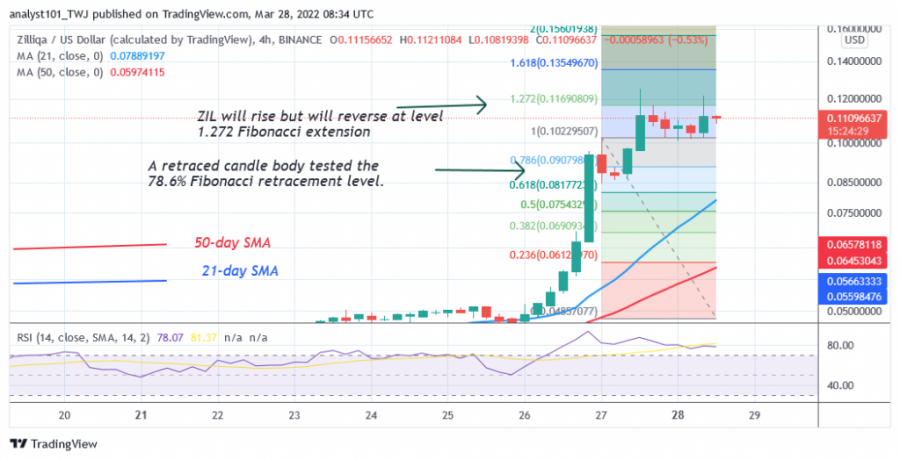
Zilliqa (ZIL) is in an uptrend after the cryptocurrency rose above the $0.04 support and reached a high of $0.125. Since March 27, buyers have been unable to sustain the bullish momentum above the recent high. The altcoin declined and consolidated again below the recent high. The Relative Strength Index for period 14 shows that the market has reached the overbought condition since March 26. Currently, the RSI has dropped from a high of 93 to 76. This shows that ZIL/USD is still in the overbought zone and can fall.
Meanwhile, the March 27 uptrend has a candle body testing the 78.6% Fibonacci retracement level. The retracement suggests that ZIL will rise but reverses at the Fibonacci extension of 1.272 or $0.1169. The price action shows that the market is reversing after reaching the high at $0.12. Zilliqa was the best performing cryptocurrency last week. It has the following characteristics:
Price: $0.1107
Market capitalization: $2,323,710,227
Trading volume: $2,898,287,649
7-day gain: 156.24%
Gnosis
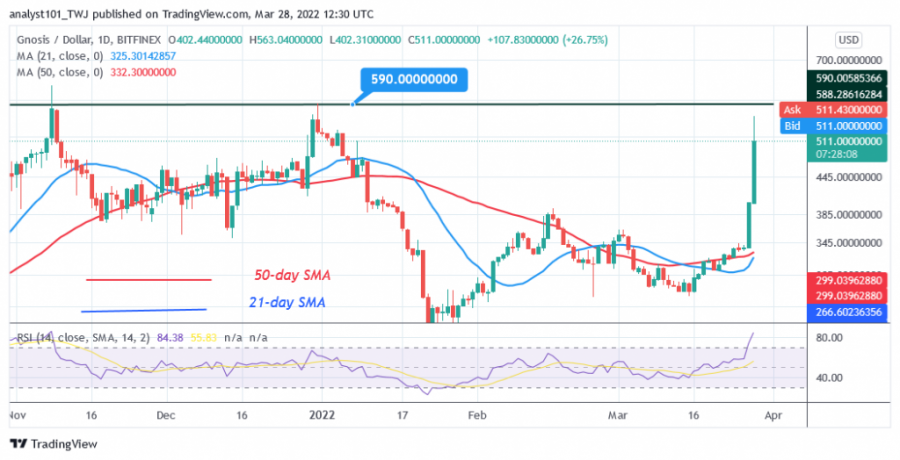
Gnosis (GNO) is in a sideways trend. Since November 8, the bulls have failed to break the overriding resistance at $590. On March 15, the altcoin fell to a low of $280 and then recovered. The bulls broke through the moving averages and reached the high of $563. The altcoin is falling after retesting the $590 resistance zone.
GNO is also at the 83 level of the Relative Strength Index for the period 14. Further upward movement is unlikely as the altcoin reaches the overbought zone of the market. The cryptocurrency will decline above the moving averages. It is the cryptocurrency with the second best performance last week. It has the following characteristics:
Price: $507.21
Market capitalization: $5,072,084,580
Trading volume: $122,672,421
7-day gain: 56.44%
Convex Finance
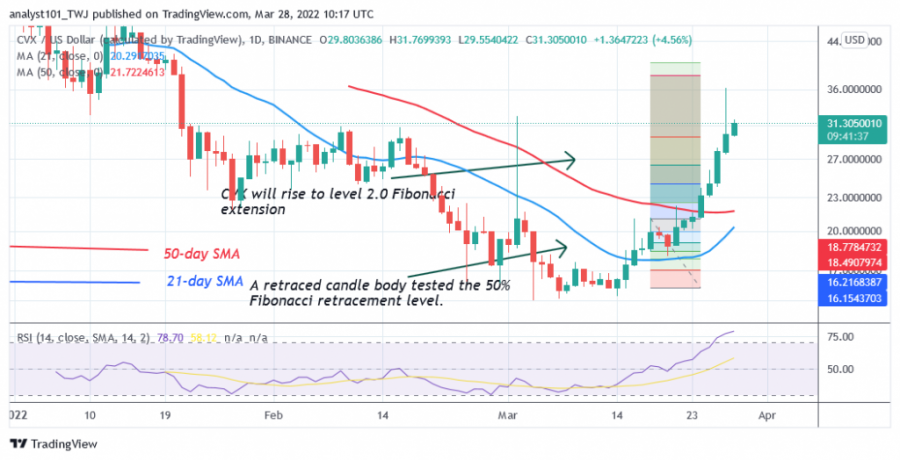
Convex Finance (CVX) has regained bullish momentum after prices rose above the moving averages. The downtrend was broken on March 4 when the price fell to $14 and recovered. The bulls broke through the $20 and $30 resistance levels as the altcoin continued its uptrend.
Meanwhile, on March 17, a retracement candlestick tested the 50% Fibonacci retracement level. The retracement suggests that CVX will rise to the 2.0 Fibonacci extension level or $26. From the price action, it appears that the altcoin has risen above the 2.0 Fibonacci extension. CVX is the altcoin with the third best performance in the past week. The cryptocurrency has the following characteristics:
Price: $31.39
Market capitalization: $3,139,008,696
Trading volume: $43,508,606
7-day gain: 49.48%
VeChain
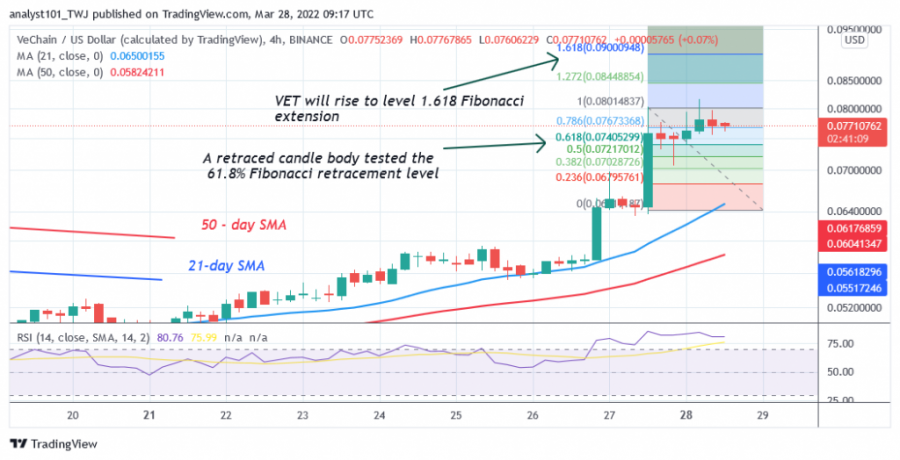
VeChain (VET) is in an uptrend as the price breaks above the moving averages. The cryptocurrency price is posting a series of higher highs and higher lows. It is likely that the cryptocurrency will experience another upward push as the price consolidates at the recent high. However, VET is at level 79 of the Relative Strength Index for period 14, which means that VET has reached the overbought area of the market. Currently, the altcoin is consolidating below the resistance at $0.08. The uptrend will resume when the price breaks the recent high.
In the meantime, the March 27 uptrend has a candle body testing the 61.8% Fibonacci retracement level. The retracement suggests that VET will rise to the Fibonacci extension level of 1.618 or $0.09. It is the cryptocurrency with the fourth best performance last week. It has the following characteristics:
Price: $0.07665
Market capitalization: $6,646,811,375
Trading volume: $2,559,181,499
7-day gain: 48.67%
Holo
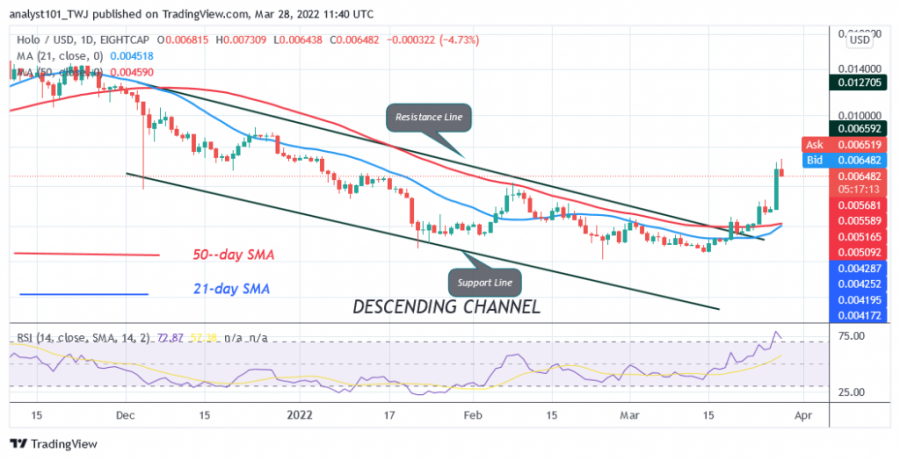
Holo (HOT) broke above the moving averages after a downward correction. The downtrend subsided on February 24 when the market fell back to $0.0035 and rallied. On March 19, the bulls broke through the moving averages and rallied to a high of $0.007. At the recent high, the Relative Strength Index for Period 14 reached a high of 79. This indicates that the market has reached the overbought zone.
Sellers will appear in the overbought region and push prices down. Currently, the altcoin is retreating as sellers are showing up in the overbought region. The market will rise again if the cryptocurrency falls back above the moving averages. Holo was the fifth best performing cryptocurrency last week. It has the following characteristics:
Price: $0.006524
Market capitalization: $1,161,845,865
Trading volume: $615,033,082
7-day gain: 47.88%
Disclaimer. This analysis and forecast are the personal opinions of the author and are not a recommendation to buy or sell cryptocurrency and should not be viewed as an endorsement by CoinIdol. Readers should do their research before investing funds.
Price
News
Price
Price
Price

(0 comments)