Weekly Cryptocurrency Market Analysis: Altcoins Are On The Right Track While Cryptos Remain In Bullish Trend Zones

The trending altcoins have broken through the moving average lines.
The initial resistance levels for cryptocurrencies have also been breached. Meanwhile, the current uptrends have run out of steam due to overbought conditions. So let us take a closer look at some of these alternative currencies.
XDC Network
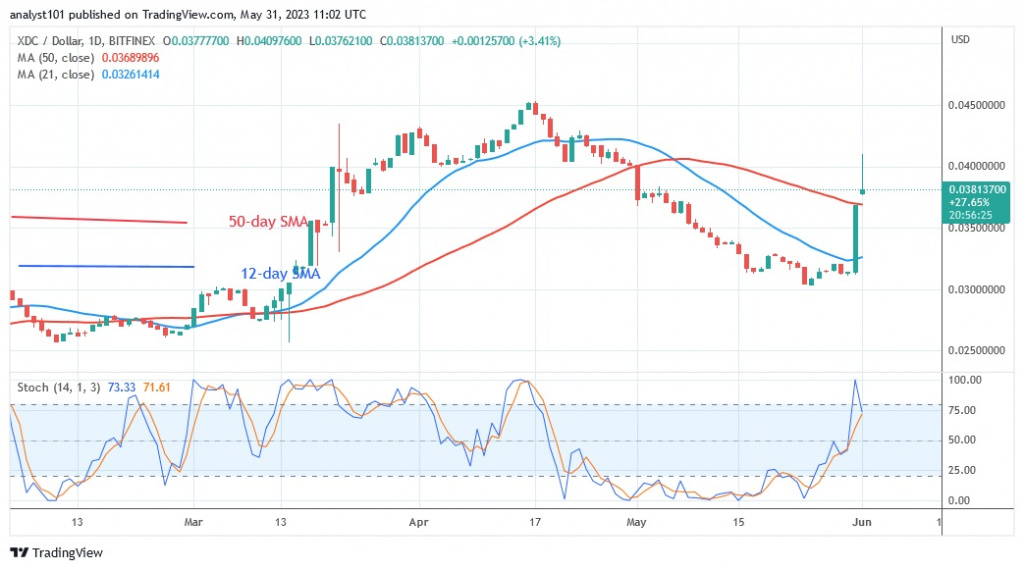
The price of XDC Network (XDC) is moving upwards after crossing the moving average lines. Before regaining the ground above the moving average lines, the cryptocurrency rose to a high of $0.040. At the time of writing, the coin is trading at $0.038. The positive momentum is likely to continue as the altcoin pulls back above the moving average lines. If the uptrend continues, XDC will rise back to its previous high of $0.045. However, if the altcoin falls below the 12-day line SMA, selling pressure will resume. XDC will then fall back to its previous low of $0.030. Currently, the altcoin is rising above the daily stochastic threshold of 80. Since the altcoin is currently overbought, its price could fall. The cryptocurrency XDC, which is currently performing the best, has the following characteristics:
Current price: $0.03828
Market capitalization: $1,441,131,799
Trading volume: $8,760,795
7-day gain/loss: 26.38%
Quant
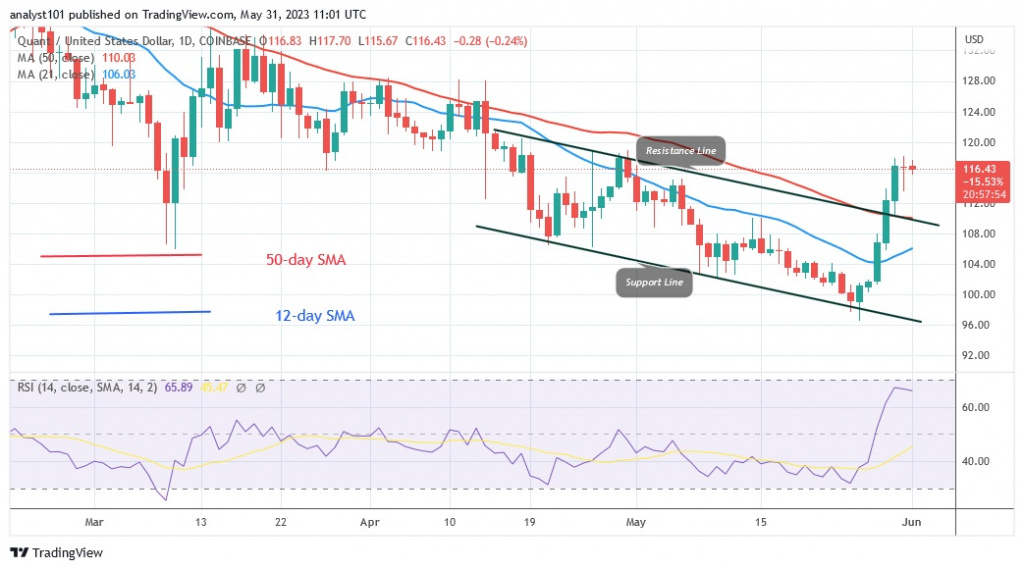
The price of Quant (QNT) has risen above the moving average lines, signaling an uptrend. There is still positive momentum as it approaches the $120 high. However, the altcoin is likely to face resistance at the $128 high. The value of the asset in cryptocurrencies is approaching the overbought area of the market. At the time of writing, QNT is currently trading at $117.62. If it falls below the moving average lines, the market will reject the recent high. However, a break below the 12-day line SMA would signal a resumption of the downtrend. On the Relative Strength Index for the 14 period, QNT is at level 67. QNT is now trading near a positive trend. The second cheapest cryptocurrency is QNT.
Current price: $117.63
Market capitalization: $1,753,611,763
Trading volume: $24,785,356
7-day gain/loss: 17.79%
The Graph
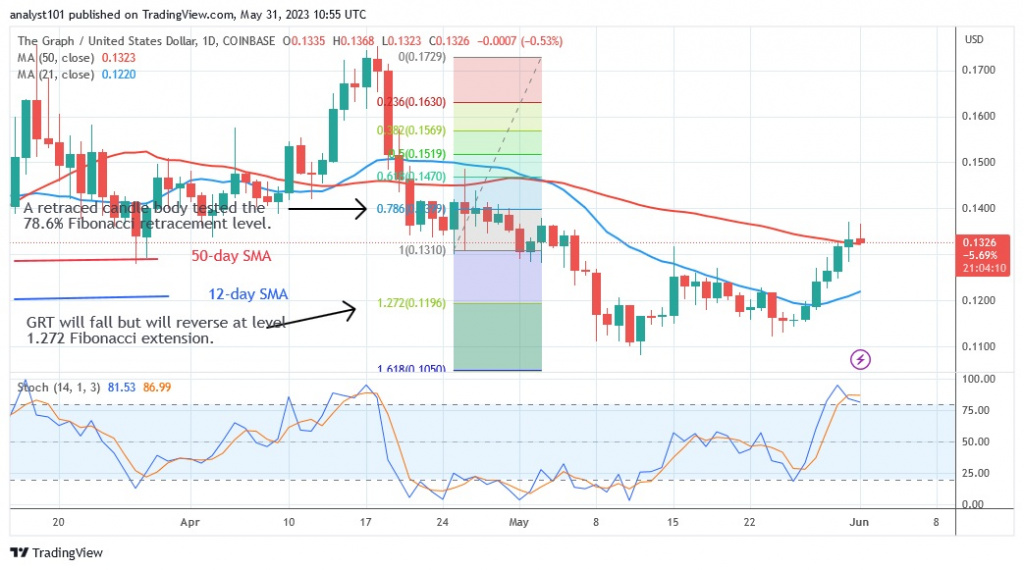
The Graph (GRT) that broke out above the moving average lines is correcting up. The bullish momentum rose to a high of $0.15 while it continued to rise above the moving average lines. The altcoin has managed to reach the overbought area of the market. The current upswing could continue if it retraces and finds support above the moving average lines. The price of GRT is $0.13 at the time of writing, and the value of the cryptocurrency will rise to retest the previous highs of $0.15 and $0.17. GRT will trend downward if the bears fall below the 12-day line SMA. Going forward, the market will decline and retest its previous low at $0.12. At a stochastic reading of 80 on the daily basis, GRT's bearish momentum begins. With the third place, GRT has performed like other cryptocurrencies.
Current price: $0.1361
Market capitalization: $1,452,263,362
Trading volume: $183,315,711
7-day gain/loss: 17.72%
SingularityNET
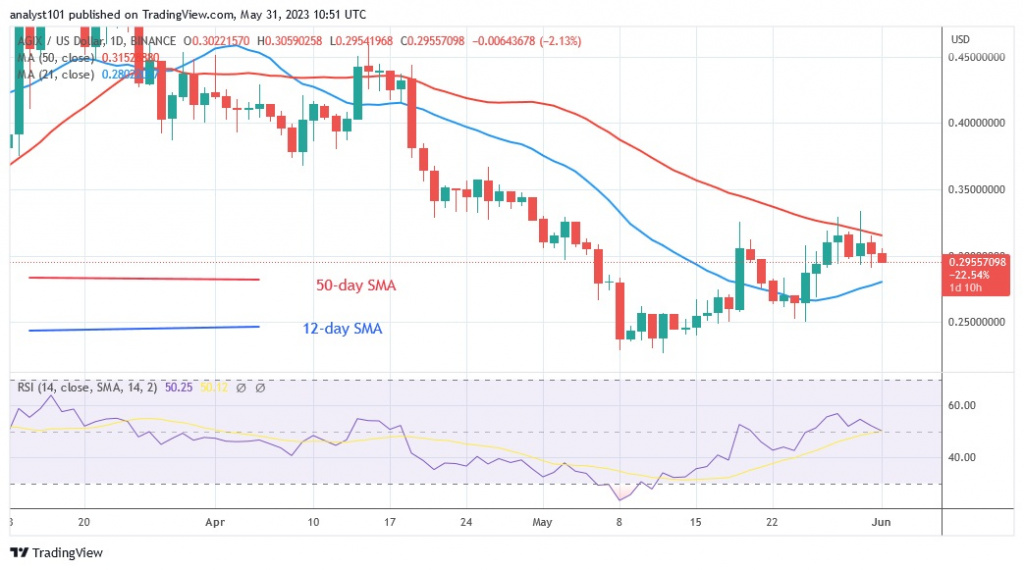
Although SingularityNET (AGIX) is correcting higher, it is pinned between the moving average lines. After falling to a low of $0.22, the cryptocurrency asset has already recovered. Since May 19, the cryptocurrency has oscillated between the moving average lines. Twice, rising advances were rejected by the 50-day line SMA. The altcoin is falling while approaching the 21-day line SMA. The cryptocurrency will either rise or fall when the moving average lines are crossed. At the time of writing, AGIX was trading for $0.29. AGIX is in the bullish trend zone, with the cryptocurrency's Relative Strength Index for the 14 period at 52. AGIX is the fourth best performing cryptocurrency. Attributes include the following:
Current price: $0.293
Market capitalization: $587,329,133
Trading volume: $64,848,052
7-day gain/loss: 16.26%
Injective
The price of Injective (INJ) is moving sideways and is trapped between the moving average lines. Before April 16, the cryptocurrency had been rising, but it was broken. The price fell because buyers could not keep it above $9.00, which caused the fall. INJ will be forced to fluctuate between the moving average lines for a few days. The altcoin will perform when the moving average lines cross. The cryptocurrency is moving bearishly below the daily stochastic barrier of 80. The characteristics of INJ, the fifth best performing cryptocurrency, are as follows:
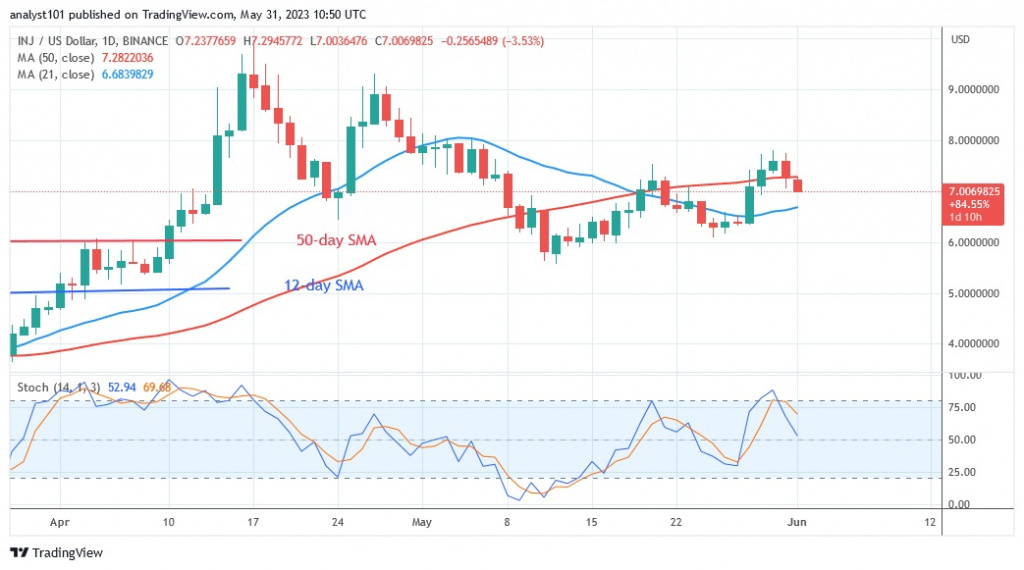
Current price: $7.20
Market capitalization: $719,783,501
Trading volume: $51,776,035
7-day gain/loss: 15.12%
Disclaimer. This analysis and forecast are the personal opinions of the author and are not a recommendation to buy or sell cryptocurrency and should not be viewed as an endorsement by CoinIdol. Readers should do their own research before investing in funds.
Price
News
Price
Price
News

(0 comments)