Weekly Cryptocurrency Market Analysis: Altcoins Resume Downtrend as Cryptos Attract Buyers at Lower Price Levels
Updated: Jul 07, 2022 at 12:33

The worst-performing altcoins have failed to hold their previous support levels as cryptos have fallen below their moving average lines. The downtrend has eased as some high-profile cryptocurrencies have resumed their recovery rally.
1inch Network
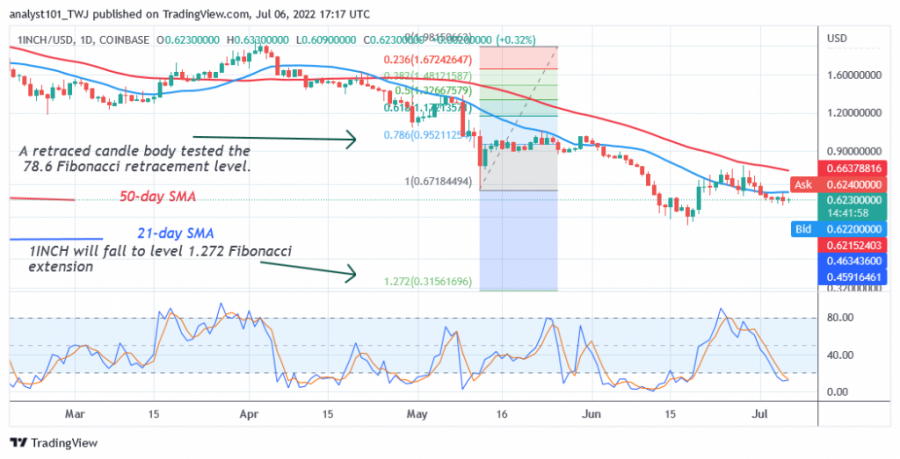
1inch Network (1INCH) is in a downward correction as the altcoin falls below its moving average lines. On June 28 uptrend, the bulls broke the 21-day line SMA but failed to break the 50-day line SMA. The altcoin was rejected at the recent high and fell below the moving average lines. If the price breaks below the moving averages, the altcoin will continue to fall.
Meanwhile, on May 12 downtrend, a retraced candle body tested the 78.6% Fibonacci retracement level. The retracement indicates that the altcoin will fall, but reverse at the level of 1.272 Fibonacci extension or the price level of $0.31. Altcoin is below the 20% area of the daily stochastic. This indicates that the market has reached the oversold area. It is the cryptocurrency with the lowest performance in the past week. It has the following characteristics:
Price: $0.6263
Market capitalization: $933,768,207
Trading volume: $42,340,834
7-day loss: 16.03%
Stacks
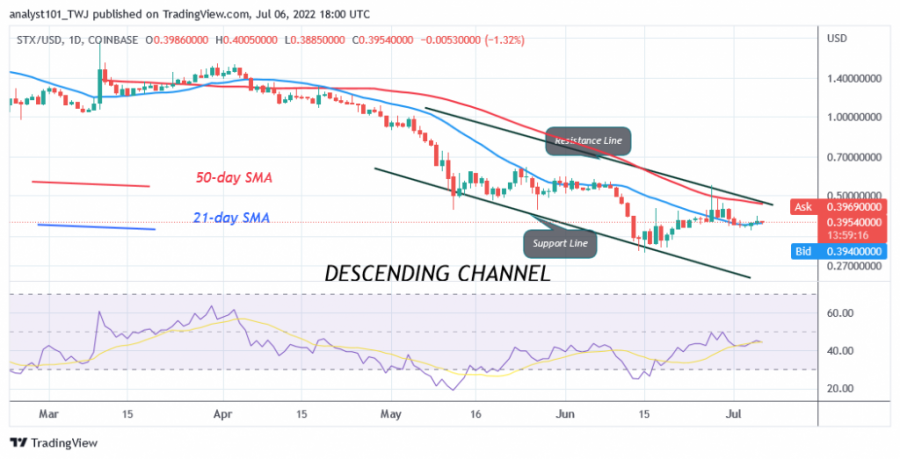
Stacks (STX) is in a downtrend as it fell to the low of $0.30 and the bulls bought the dips. The altcoin made an upward correction as the price broke above the 21-day line SMA, but failed to break the 50-day line SMA. The altcoin is trading between the moving average lines. A break below the 21-day line SMA would mean the resumption of the downtrend. If the bulls overcome the 50-day line SMA, the altcoin will resume its uptrend. The cryptocurrency will visit the previous high of $0.63. The altcoin is at level 44 of the Relative Strength Index for the period 14, which means that STX is in a downtrend and can continue to fall. It is the cryptocurrency asset with the second worst performance this week. The cryptocurrency has the following characteristics:
Price: $0.3947
Market capitalization: $717,628,963
Trading volume: $13,881,839
7-day loss: 12.30%
KuCoin Token
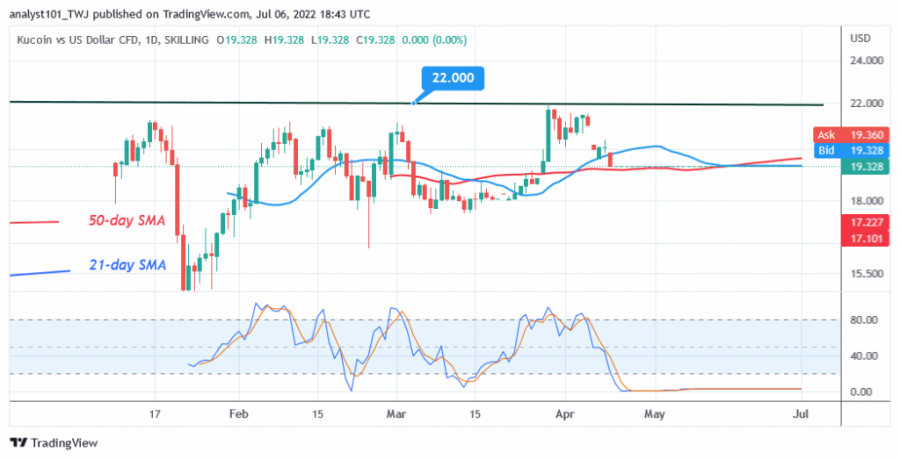
KuCoin Token (KCS) is in a sideways trend. Since January 16, buyers have failed to hold above the oversold resistance level of $22. The cryptocurrency has fallen and is between the moving average lines. There has been no significant price movement as the altcoin falls into an oversold area of the market. In other words, KCS is below the 20% area of the daily stochastic. The altcoin is the cryptocurrency with the third worst performance this week. The cryptocurrency has the following characteristics:
Price: $8.86
Market capitalization: $1,506,766,546
Trading volume: $5,817,600
7-day loss: 12.22%
Huobi Token
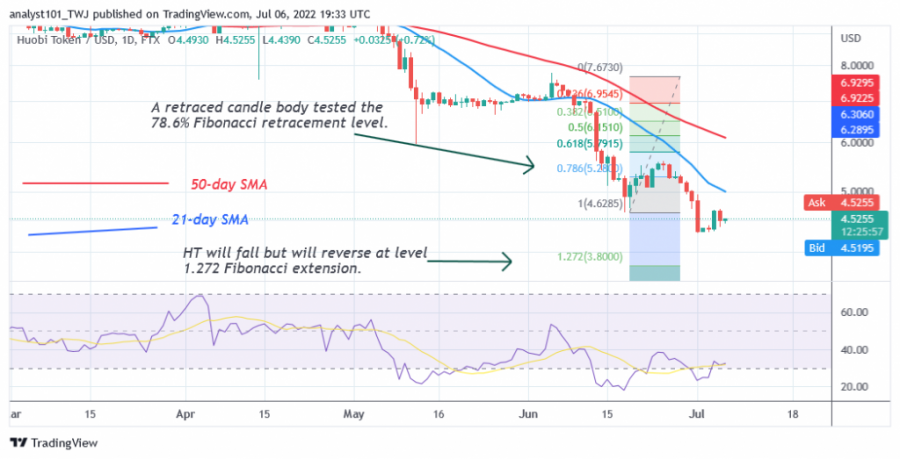
Huobi Token (HT) is in a downtrend, but the price of the cryptocurrency has fallen below the moving average lines. On June 26, the upward correction was averted when the altcoin fell to the previous low. Meanwhile, on May 19 downtrend, a retraced candle body tested the 78.6% Fibonacci retracement level. The retracement suggests that the altcoin will fall, but reverse at the level of 1.272 Fibonacci extension or $3.80.
Nevertheless, the cryptocurrency is at level 32 of the Relative Strength Index for the period 14. It is in the bearish trend zone and approaching the oversold area of the market. HT is the cryptocurrency with the fourth worst performance in the past week. It has the following characteristics:
Price: $4.52
Market capitalization: $2,259,158,409
Trading volume: $21,385,616
7-day loss: 11.73%
Dash
Dash (DASH) is in a downtrend, and the crypto price is posting a series of lower highs and lower lows. The altcoin will likely continue to decline as it trades below the moving average lines. Moreover, the upward movement is limited by the 21-day moving average line.
Meanwhile, on May 12 downtrend, a retraced candle body tested the 78.6% Fibonacci retracement level. The retracement suggests that the altcoin will fall, but reverse at the level of 1.272 Fibonacci extension or $27.99. Nevertheless, DASH is at level 40 of the Relative Strength Index for the period 14, which means that the market is in a downtrend and could fall. It is the cryptocurrency with the fifth worst performance this week and has the following characteristics:
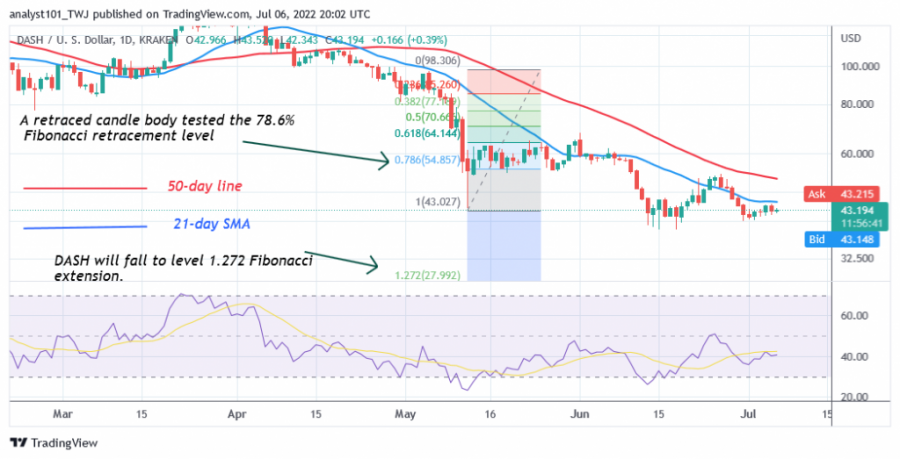
Price: $43.33
Market capitalization: $820,244,387
Trading volume: $74,726,210
7-day loss: 4.62%
Disclaimer. This analysis and forecast are the personal opinions of the author and are not a recommendation to buy or sell cryptocurrency and should not be viewed as an endorsement by CoinIdol. Readers should do their research before investing funds.
Price
News
Price
Price
Price

(0 comments)