Weekly Cryptocurrency Market Analysis: Altcoins Decline Due To An Overbought Scenario
Updated: Feb 20, 2023 at 13:32
This week, cryptocurrency prices have reached an overbought area of the market.
Cryptocurrencies are either falling or trapped in the overbought zone. Doji candlesticks have prevented the price of cryptocurrencies from moving. We will take a closer look at some of these cryptocurrencies.
Blur
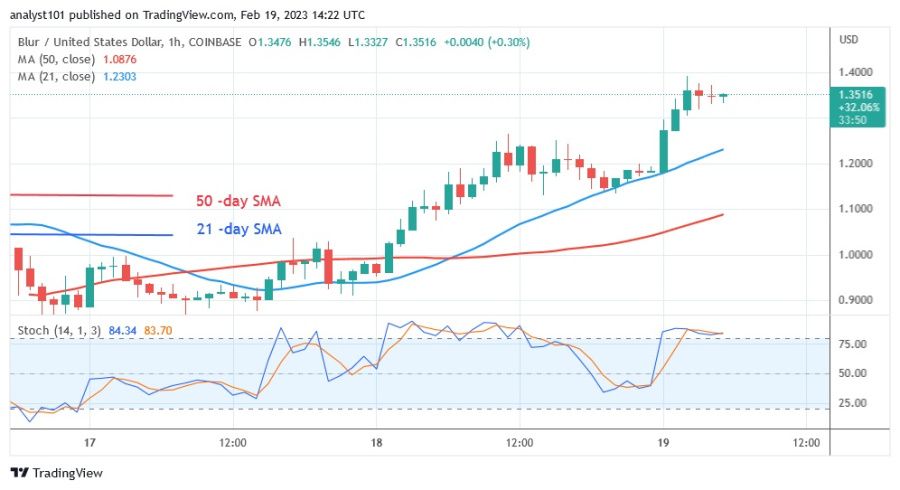
Blur (BLUR) is moving upwards and reached a high of $1.35. Previously, the cryptocurrency was in a downtrend and reached a low of $0.48. The altcoin resumed its upward movement as bulls bought the price dip. As the altcoin resumed its climb, the bullish momentum broke through the resistance at $1.28. The daily stochastic for the altcoin is above the level of 80. The market for the altcoin is now overbought. At its recent high, the altcoin could be rejected. During the week, the altcoin had the worst performance. It has the following characteristics:
Current price: $1.37
Market capitalization: $4,014,765,464
Trading volume: $706,893,322
Mina
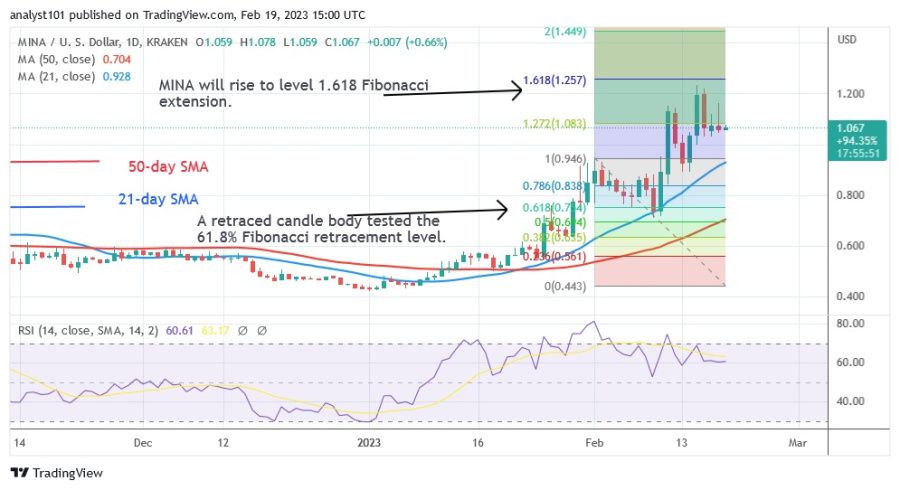
Mina (MINA), which reached a high of $1.20 before being pulled back, is in an uptrend. The uptrend has been halted since February 15. At the current price level, the market is overbought. A retraced candle body of the uptrend from February 1 tested the 61.8% Fibonacci retracement line. According to the retracement, MINA will rise to the level of 1.618 Fibonacci Extension or $1.25. The altcoin has a bullish momentum above the Relative Strength Index level of 60 for the period 14. The second worst cryptocurrency is MINA. It has these characteristics:
Current price: $1.07
Market capitalization: $876,477,014
Trading volume: $66,509,516
7-day gain/loss: 5.21%
Hedera
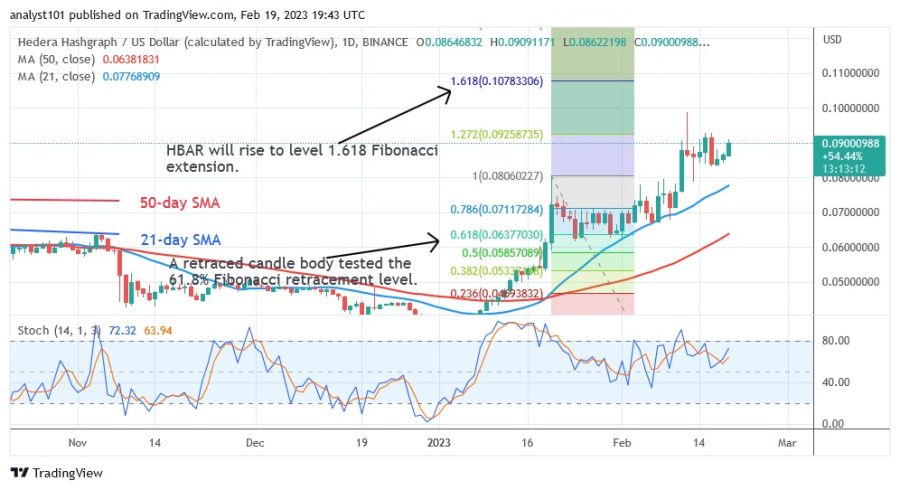
Hedera (HBAR), which has risen to a high of $0.09, is in an uptrend. Resistance at $0.09 has been the crux of the uptrend since February 11. Buyers are currently trying to break through this resistance level. If the current resistance level is broken, a rise to $0.11 is likely. The price indicator predicts that the price of the cryptocurrency is likely to continue to rise and reach the previous Fibonacci extension level high of $1.618 or $0.10. The stochastic indicator on the daily chart is at 60, where the cryptocurrency is in a positive momentum. Among all cryptocurrencies, the altcoin had the third worst weekly performance. The cryptocurrency's characteristics include:
Current price: $0.09038
Market capitalization: $4,520,239,378
Trading volume: $49,514,105
7-day gain/loss: 4.51%
Huobi Token
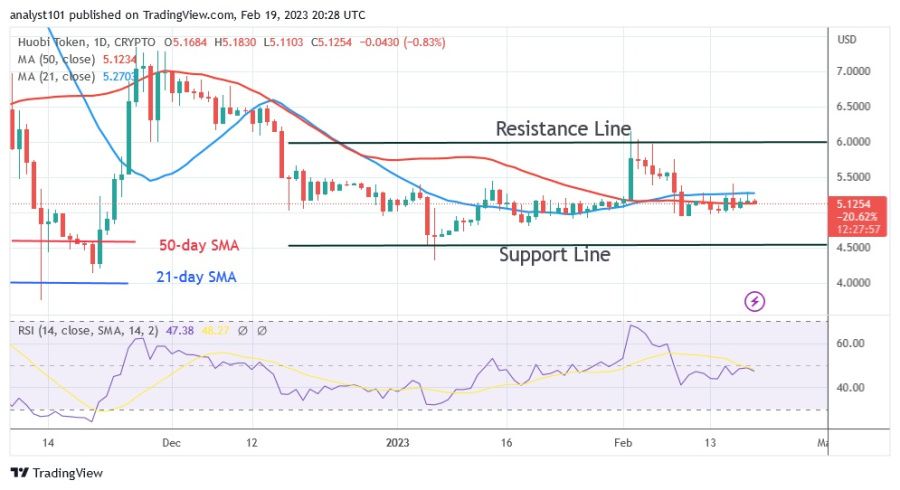
Huobi Token (HT), an altcoin, has been trading between $4.50 and $6.00 since December 16. On February 2, buyers failed to keep the price above the $6.00 resistance. Below the moving average lines, HT declined. The altcoin is currently settling above $5.00. The current price movement is characterized by doji candlesticks, which have a small body and are indecisive. Below the moving average lines, the price movement has remained unchanged. The relative strength index for the period 14 is 47, indicating a downward trend for the altcoin. The coin with the fourth worst performance is Huobi token. The cryptocurrency's features include:
Current price: $5.14
Market capitalization: $2,571,696,312
Trading volume: $16,406,641
7-day gain/loss: 1.62%
PAX Gold
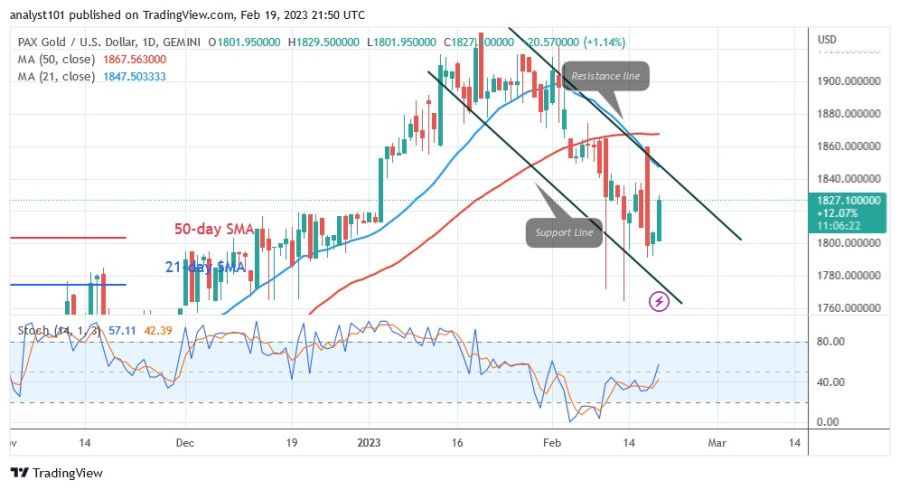
PAX Gold (PAXG) is in a downtrend as the altcoin approaches the $1,930 overbought area. The uptrend was resisted during the last price action as it approached the overbought zone. The cryptocurrency price made two attempts to break above the barrier at $1,920 before falling below the moving average lines. When the support at $1,800 was reached, the decline stopped. Today, the price of the cryptocurrency started to move above the existing support again. If the price of the altcoin rises above the moving average lines, the bullish momentum will return. Above the stochastic level of 40 on the daily basis, PAXG has positive momentum. This week it ranks as the fifth worst cryptocurrency. It has these characteristics:
Current price: $1,824.93
Market capitalization: $495,113,646
Trading volume: $5,842,950
7-day gain/loss: 0.03%
Disclaimer. This analysis and forecast are the personal opinions of the author and are not a recommendation to buy or sell cryptocurrency and should not be viewed as an endorsement by CoinIdol. Readers should do their research before investing in funds.
Price
News
Price
Price
Price

(0 comments)