Weekly Cryptocurrency Market Analysis: Altcoins Experience Overbought Conditions And A Decline
Updated: Feb 09, 2023 at 11:02

The price of cryptocurrencies is falling as altcoins enter overbought areas of the market.
Below the recent high, during the initial downturn, buyers and sellers are experiencing a period of uncertainty. Most altcoins are currently forced to fall or move sideways. Several of these cryptocurrencies will be discussed.
SingularityNET
SingularityNet (AGIX), which was rejected when its price peaked at $0.67, is currently declining. Previously, the crypto asset was on an uptrend. The altcoin reached an overbought area of the market before being rejected. As the decline entered the oversold zone, the selling pressure is likely to end. However, the cryptocurrency fell below the 21-day line SMA, while it rose above the 50-day line SMA. This suggests that AGIX will likely continue to trade within the moving average lines for a few more days. If the moving average lines are broken, the altcoin will reenter the trend. AGIX is currently trading in an oversold area of the market. The daily stochastic is currently below the level of 20. Altcoin, the best performing cryptocurrency, has the following characteristics:
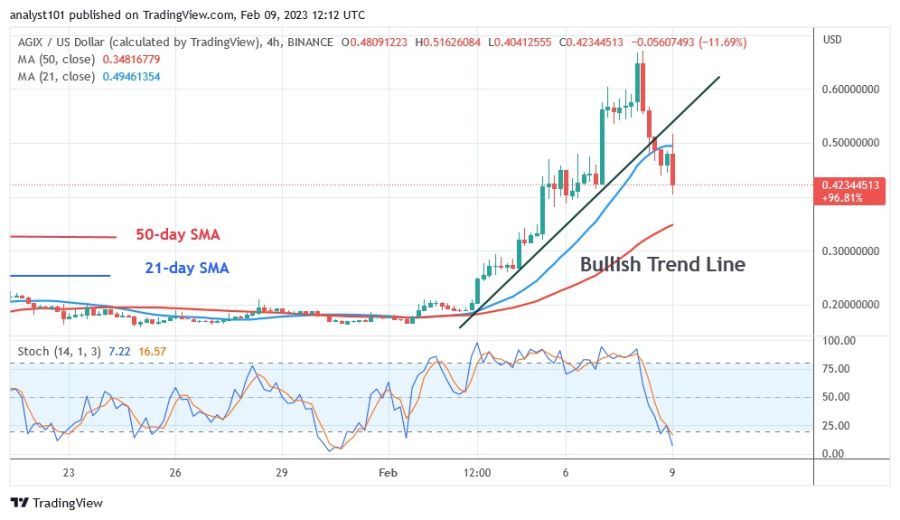
Current price: $0.4252
Market capitalization: $850,410,426
Trading volume: $453,099,637
7-day gain/loss:128.50%
The Graph
The Graph (GRT) is in an uptrend, but the rise has stalled at the high of $0.23. GRT is moving back towards the low above the SMA for the 21-day line. If the price finds support above the 21-day line SMA, the current uptrend could resume. However, the uptrend is expected to stall if the altcoin falls below the 21-day SMA line. The altcoin is currently trading at the 68 level of the Relative Strength Index for the 14 period and is in the uptrend zone. As long as the altcoin trades in the uptrend zones, further gains are possible. It is the second highest cryptocurrency and has the following characteristics:
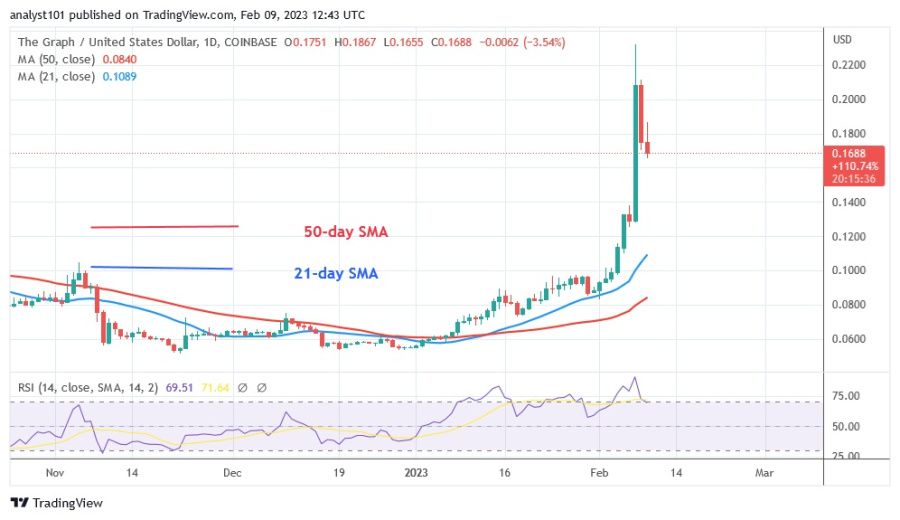
Current price: $0.1675
Market capitalization: $1,789,817,908
Trading volume: $562,439,211
7-day gain/loss: 90.43%
WOO Network
The price of WOO Network (WOO) broke below the moving average lines, signaling a downturn. Prior to the recovery, the cryptocurrency asset was in an uptrend, trading at a high of $0.25. The price of the cryptocurrency has continued to fall after dropping below the moving average lines. WOO will continue to fall to a low of $0.10. Stochastic on the daily chart is approaching the 20 level. The third best cryptocurrency is WOO. It has these characteristics:
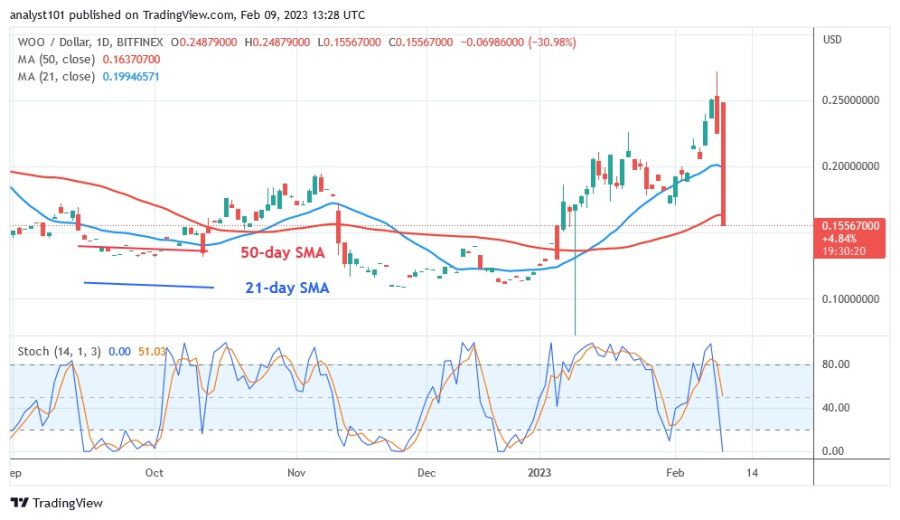
Current price: $0.2501
Market capitalization: $563,837,927
Trading volume: $101,786,634
7-day gain/loss: 29.57%
Frax Share
Frax Share (FXS) reached a high of 14.32 and is in an uptrend. The market is overbought due to the current upswing. The altcoin reached its recent high before falling back. A retracement candlestick of the January 20 uptrend tested the 78.6% Fibonacci retracement line. The retracement shows that FXS will rise but will reverse at the Fibonacci extension of $1.272 or $13.55. Above the stochastic level of 75 on the daily basis, FXS is in a positive momentum. The overbought area of the market is getting closer to the coin. It is unlikely that it will continue to move higher. It has the following characteristics and is the fourth best performing cryptocurrency:
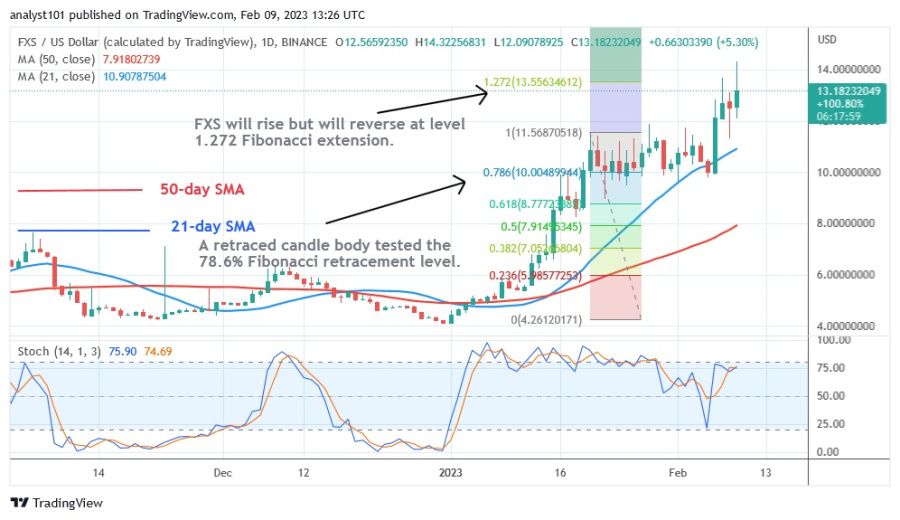
Current price: $13.11
Market capitalization: $1,292,812,914
Trading volume: $204,220,259
7-day gain/loss: 21.45%
ImmutableX
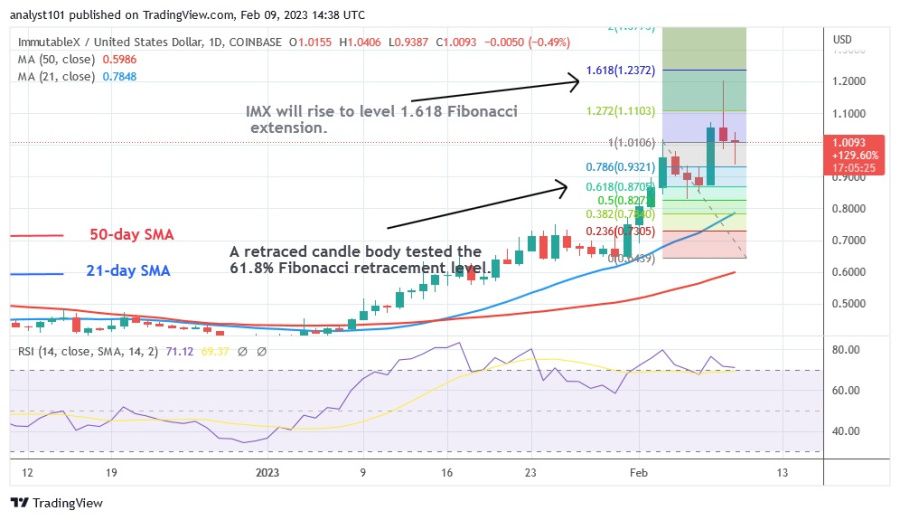
The price of ImmutableX (IMX) is on the rise, reaching a high of $1.20. As the price of the cryptocurrency approaches the overbought zone, it records a series of higher highs and higher lows. As IMX enters the $1.20 overbought zone, it makes a pullback. A bearish candlestick tested the 61.8% Fibonacci retracement line on the February 3 bounce. According to the retracement, IMX will rise to the Fibonacci extension level of $1.618 and $1.23, respectively. As the market enters the overbought zone, further upward movement is unlikely. For the 14 period, the IMX is at the 71 level of the Relative Strength Index. Bullish exhaustion has been reached in the current rally. The altcoin is the fifth best performer. It has the following characteristics:
Current price: $1.01
Market capitalization: $2,018,965,044
Trading volume: $77,628,516
7-day gain/loss: 18.89%
Disclaimer. This analysis and forecast are the personal opinions of the author and are not a recommendation to buy or sell cryptocurrency and should not be viewed as an endorsement by CoinIdol. Readers should do their research before investing in funds.
Price
Price
News
Price
Price

(0 comments)