Weekly Cryptocurrency Market Analysis: Altcoins Are In A Range Of Lower Highs And Lower Lows, With An Eye On A Possible Rebound

This week's cryptocurrencies share similar characteristics. Altcoins are in a downtrend after being rejected from overhead resistance levels.
Cryptocurrencies have crashed as they approach the oversold area of the market. Altcoins will only recover if they attract buyers in the oversold areas. We will discuss some of these altcoins in more detail later.
Stacks
Stacks (STX) is in a downtrend after falling below the 21-day simple moving average (SMA). The cryptocurrency asset has fallen into the 'oversold zone of the market. In other words, the selling pressure has been exhausted. The altcoin has been caught between the moving average lines. It is below the 21-day line SMA but above the 50-day line SMA. If the moving average lines are broken, the altcoin will resume its trend. Stacks fell from a high of $1.03 to a low of $0.56. It is now in the 'oversold region of the market and below the level 20 of the daily stochastic. As buyers emerge in the oversold region, selling pressure is likely to ease. STX, the cryptocurrency with the weakest performance at the moment, has the following characteristics.
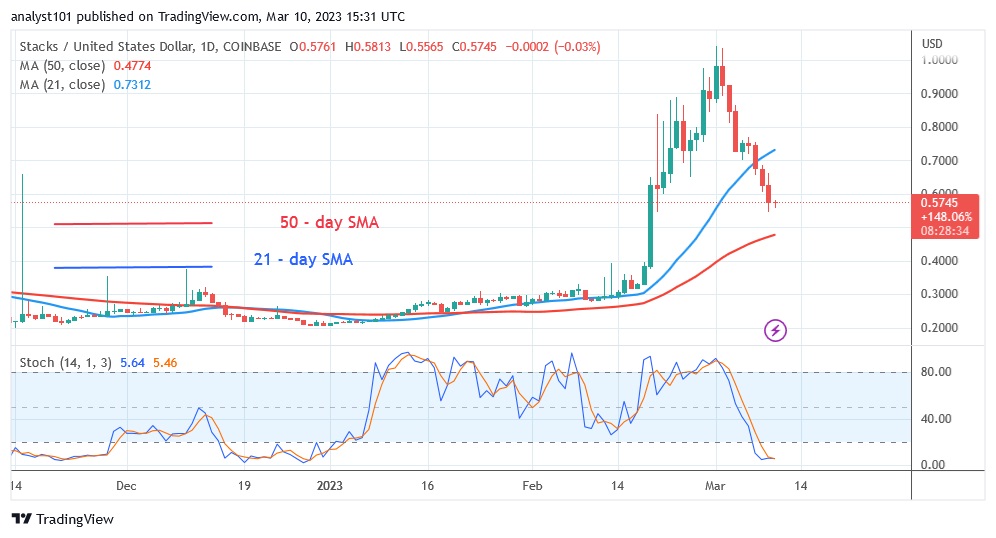
Current price: $0.5641
Market capitalization: $1,025,515,678
Trading volume: $209,407,147
7-day gain/loss: 30.38%
SingularityNET
SingularityNet (AGIX) price is falling as it breaks below the moving average lines. The altcoin previously rose to a high of $0.67 before being pushed back on February 8. After two failed attempts to break above the $0.60 resistance level, AGIX was forced to trade sideways. The altcoin experienced resistance on March 3 when the price fell below the moving average lines. When the price falls below the moving average lines, selling pressure may increase. Today, AGIX fell from a high of $0.67 to a low of $0.32. The altcoin may reach the next support level at $0.20. SingularityNet is now in a downtrend, with a Relative Strength Index of 40 for the period of 14. AGIX has the potential to deteriorate further. In the following sections, we look at AGIX, the cryptocurrency with the second worst performance.
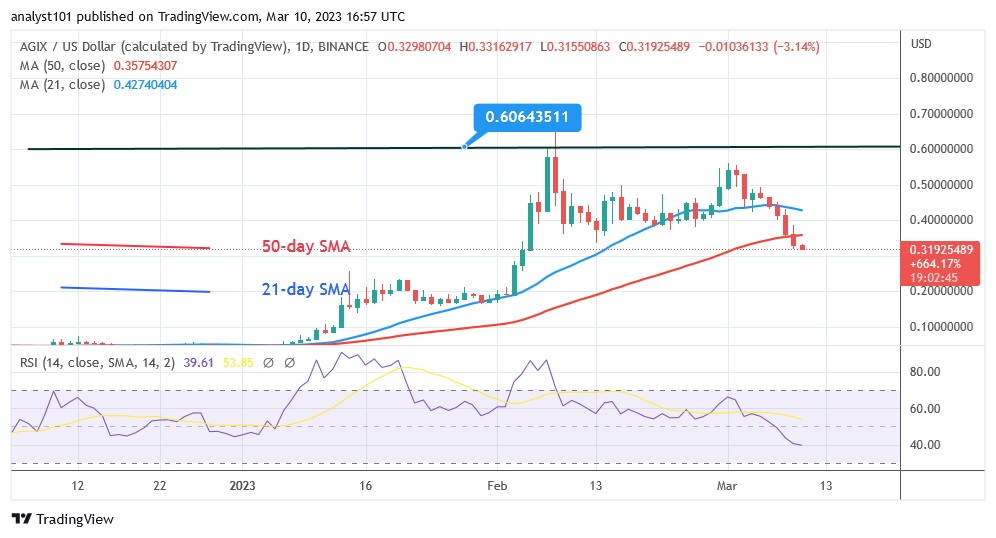
Current price: $0.325
Market capitalization: $650,252,437
Trading volume: $168,313,046
7-day gain/loss: 27.83%
Mina
Mina (MINA) is falling as it breaks the moving average lines. The cryptocurrency fell to a low of $0.65. MINA rose to a high of $1.20 on February 15, but was beaten back. The altcoin has been declining since March 15. The current decline could reach a low of $0.50. However, the altcoin has fallen into the 'oversold zone of the market. MINA /USD is trading below the daily stochastic value of 20. The selling pressure is now exhausted. If buyers appear in the oversold zone, the altcoin will regain upward momentum. The altcoin's performance this week is the third worst. The cryptocurrency's characteristics include:
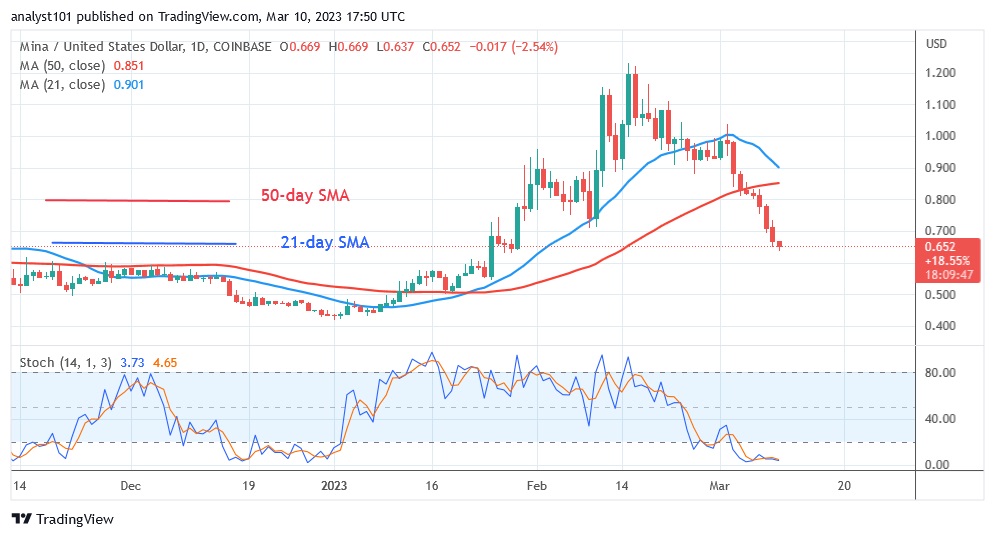
Current price: $0.6568
Market capitalization: $660,516,522
Trading volume: $54,514,470
7-day gain/loss: 25.56%
Dash
The price of Dash (DASH) is falling as it approaches the $75 resistance level. The previous price action ended the uptrend at a high of $75. However, DASH was forced to trade sideways below the resistance level. On March 2, the altcoin crashed and broke below the moving average lines and the uptrend line. DASH has fallen to a low of $51, but will continue to fall to the next support level of $45. Meanwhile, the altcoin has fallen into the 'oversold zone of the market. It is below the daily stochastic level of 20. This indicates that the selling pressure has been exhausted. The decline might end soon. DASH is the fourth worst cryptocurrency. It has the following characteristics:
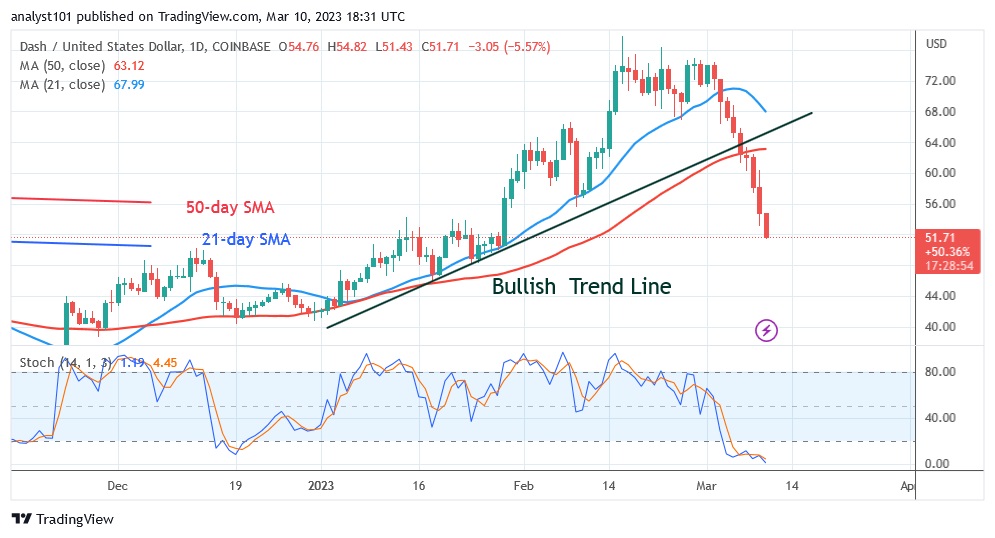
Current price: $51.26
Market capitalization: $968,441,686
Trading volume: $127,790,544
7-day gain/loss: 21.07%
Lido DAO
Lido DAO (LDO) is in a downtrend, with a sharp decline below the moving average lines. Before falling below the moving average lines, the cryptocurrency asset formed a bearish double top. Buyers were unable to keep the price above the $3.20 resistance on Feb. 18 and Feb. 27, which led to the decline. LDO has fallen to a low of $2.26 and is approaching the next support level of $2.00. Support has been above the $2.00 level since January 2023. If the altcoin holds above the $2.00 support level, it will regain bullish momentum. The cryptocurrency has been in a downtrend since period 14 and is trading below the Relative Strength Index of 38. DASH is the fifth worst cryptocurrency. It has the following characteristics:
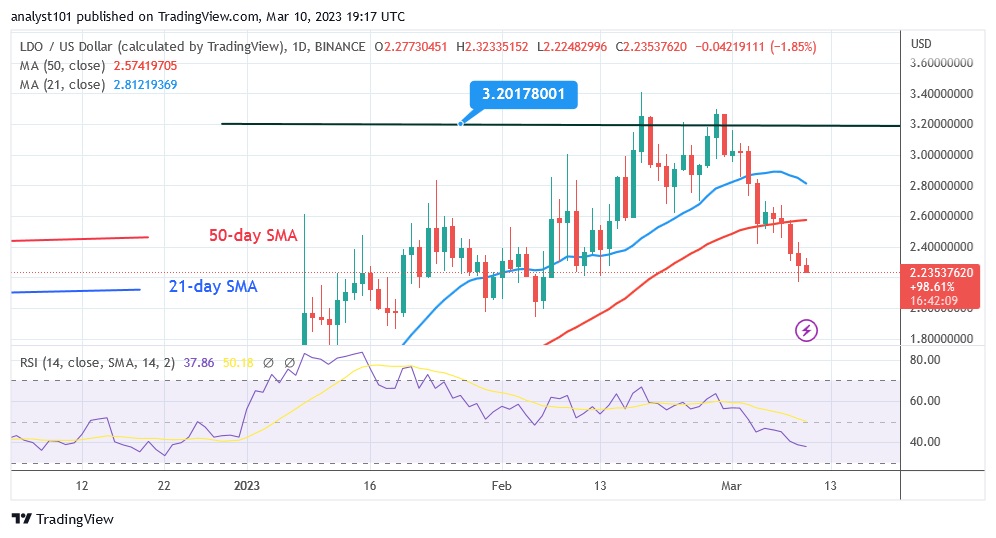
Current price: $2.24
Market capitalization: $2,237,182,457
Trading volume: $262,396,399
7-day gain/loss: 20.38%
Disclaimer. This analysis and forecast are the personal opinions of the author and are not a recommendation to buy or sell cryptocurrency and should not be viewed as an endorsement by CoinIdol. Readers should do their research before investing in funds.
Price
Blockchain
Price
Price
Price

(0 comments)