Weekly Cryptocurrency Market Analysis: Altcoins Continue Their Ascent By Regaining Historical Price Levels
Updated: Jan 18, 2023 at 14:07

After a price rally on January 4, the largest cryptocurrency has moved in the right direction. The price of BTC has now surpassed the historical mark of November 5. The increasing price movement of most altcoins is slightly affected by this.
Most of the cryptocurrencies listed below have seen a price recovery as they continue their climb and return to their respective historical price levels. We will discuss these cryptocurrencies in detail.
Decentraland
Decentraland (MANA) is in an uptrend after reaching a high of $0.75. The cryptocurrency value experienced a significant decline during the previous slump and reached its lowest point on the chart on December 31, 2022. The altcoin stabilized above the support of $0.29 and the doji candlesticks marked the price trend. The price of the cryptocurrency rose back into the overbought zone of the market after rising above the moving average lines. The altcoin rose to the historical price level of $0.74 from November 5. If buyers maintain the positive momentum above the current barrier, MANA will rise even further to the next resistance at $1.12. However, if the altcoin is rejected at the recent high, MANA will fall and trade in a range between $0.44 and $0.75. MANA is trading above the level 80 of the daily stochastic in the overbought zone. The altcoin has the characteristics indicated below and is the best performing cryptocurrency.
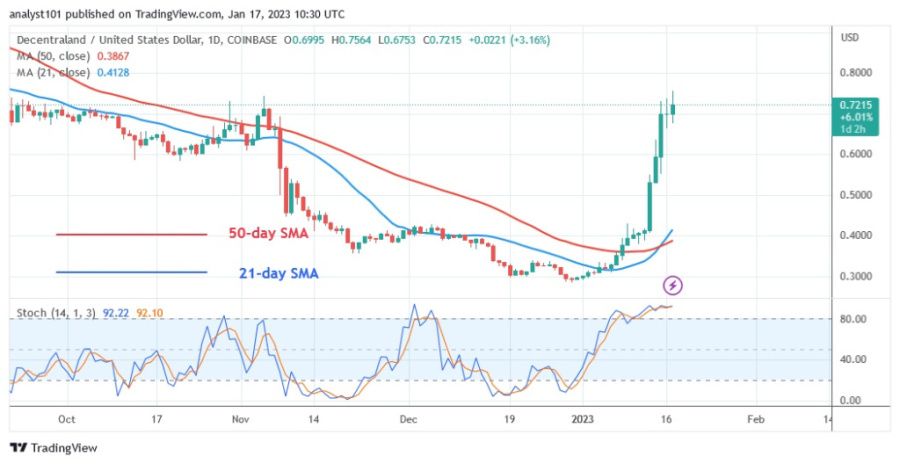
Current price: $0.723
Market capitalization: $1,583,596,373
Trading volume: $734,828,169
7-day gain/loss: 79.74%
Helium
Helium (HNT) is in an uptrend after rising above the moving average lines. The cryptocurrency asset's value has risen from a low of $1.50 to a high of $3.25. In the previous trend, HNT fell to the bottom of the chart and then started to consolidate again. At the time of writing, HNT is trading at $3.08. As the market is overbought, the current bounce has hit bullish exhaustion. HNT is going to decline on the downside. It will fall above the breakout level of $2.39. The cryptocurrency is currently at the 82 level of the Relative Strength Index for the 14 period. The altcoin is dangerously overbought and could fall. It is the second best performing cryptocurrency and has the following characteristics:
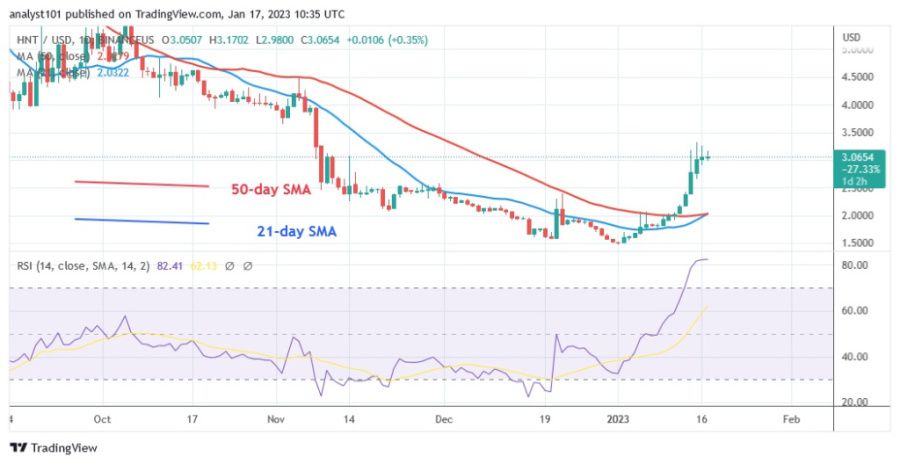
Current price: $3.09
Market capitalization: $688,269,694
Trading volume: $3,871,833
7-day gain/loss: 52.83%
Optimism
Optimism (OP), which reached a high of $1.89, has maintained its uptrend. The cryptocurrency is on the verge of reaching the historical price level of $2.18 set on August 3, 2022. By reaching a new high, the ongoing upswing has broken through the resistance at $1.40. The current resistance level is the point where the market is overbought. As it fluctuates below the $1.90 resistance level, the market has reached bullish exhaustion. The daily stochastic for OP is above the value of 80, which indicates that the altcoin has reached the overbought zone. OP is the name of the third best cryptocurrency. It has the following characteristics:
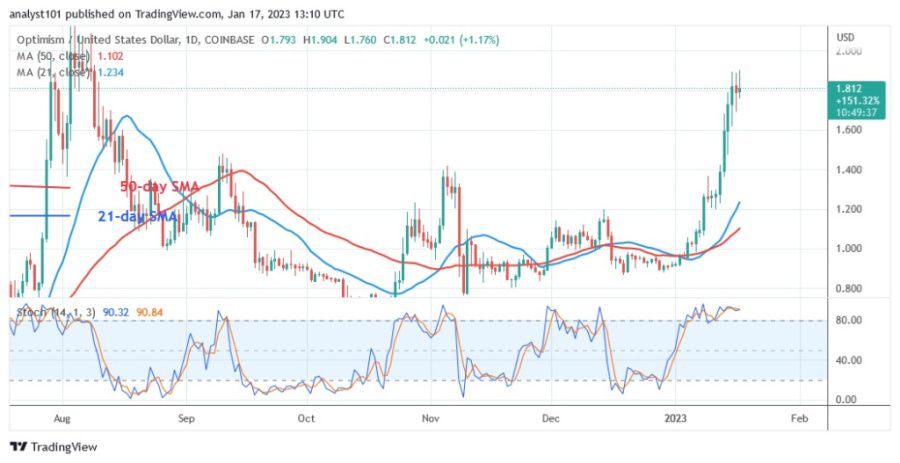
Current price: $1.82
Market capitalization: $7,820,183,019
Trading volume: $196,132,215
7-day gain/loss: 47.28%
Compound
Compound (COMP) rallied above the moving average lines and entered an uptrend. The COMP has been moving in a band between $32 and $40 since November 9. The cryptocurrency's price settled below resistance for a potential breakout, but has now fallen even further into the lower price range. The altcoin rallied on January 4 when the price crossed the moving average lines. The cryptocurrency's value rose to an overbought area at $55. The altcoin is testing a price level from the past, which was reached on October 27, 2022. On the plus side, the altcoin will reach a high of $65 if the uptrend is maintained. On the downside, the cryptocurrency will fall if it is rejected at $55. It will fall above the $40 resistance level. The altcoin is currently above the 80 level of the daily stochastic in the overbought zone. The altcoin is at risk of further loss. It has the following characteristics and is the fourth best performing cryptocurrency:
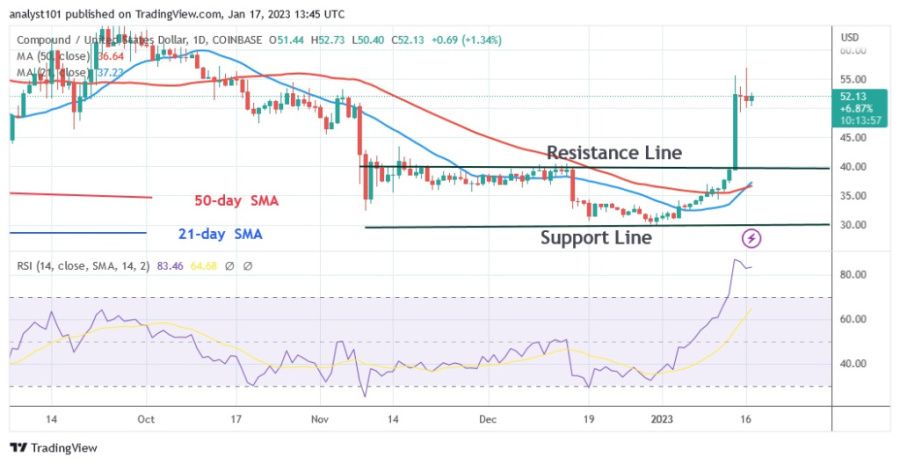
Current price: $51.99
Market capitalization: $518,864,823
Trading volume: $43,547,195
7-day gain/loss: 45.33%
Aptos
The price of Aptos (APT) rises after it rises above the moving average lines. After hitting a low of $3.46, the altcoin remained near the bottom of the chart. APT recovered on January 4 after rising above the 21-day line SMA. The altcoin reached an all-time high of $8.83. . Attempts by buyers to retrace their steps towards the previous high of $10.35 were blocked at the $9.00 resistance level. The bullish exhaustion of the upswing was achieved due to the extreme overbought position of the market. According to the Relative Strength Index for period 14, Aptos is currently at level 79. It has the following characteristics and is the fifth best performing cryptocurrency:
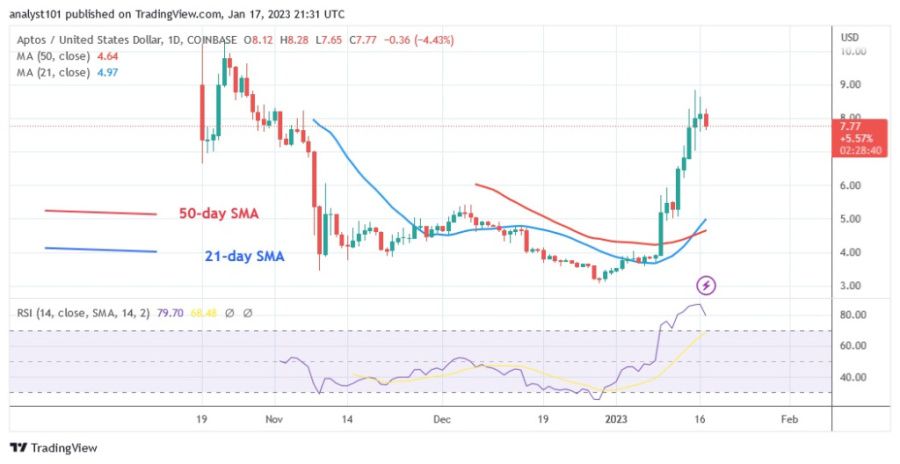
Current price: $7.77
Market capitalization: $7,766,564,937
Trading volume: $377,032,086
7-day gain/loss: 41.87%
Disclaimer. This analysis and forecast are the personal opinions of the author and are not a recommendation to buy or sell cryptocurrency and should not be viewed as an endorsement by Coin Idol. Readers should do their own research before investing in funds.
Price
News
Price
Price
Price

(0 comments)