Weekly Cryptocurrency Market Analysis: Altcoins Continue A Bearish Rise As They Hit Downtrend Zones

The cryptocurrency's slide below its moving average lines indicates a further decline. Others are trying to keep their prices above their support levels in hopes of gaining upside momentum. Let us look at each of these cryptocurrencies individually.
Sui
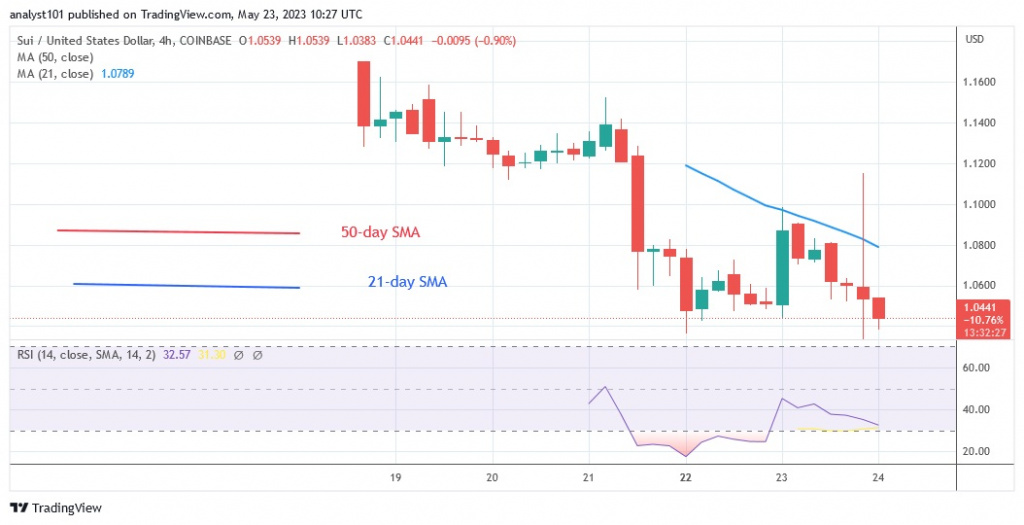
Sui (SUI) is falling below its moving average lines. On May 22, the altcoin reversed its negative trend and started to rise above the current support level of $1.03. In the last 48 hours, the altcoin fluctuated between $103 and $1.10. SUI is at risk of falling even further if the current support is threatened. The cryptocurrency's price will fall until it reaches the next support at $1.00. On May 23, buyers made efforts to keep the price above the recent high, but encountered resistance at the $1.10 high or the 21-day line SMA SUI has continued to move in a range during this time. For the 14 period, the Relative Strength Index is at level 33. The altcoin is approaching the oversold area of the market. The cryptocurrency SUI has the worst performance and the following characteristics:
Current price: $1.04
Market capitalization: $10.464.933.424
Trading volume: $143,770,550
7-day gain/loss: 12.30%
Lido DAO
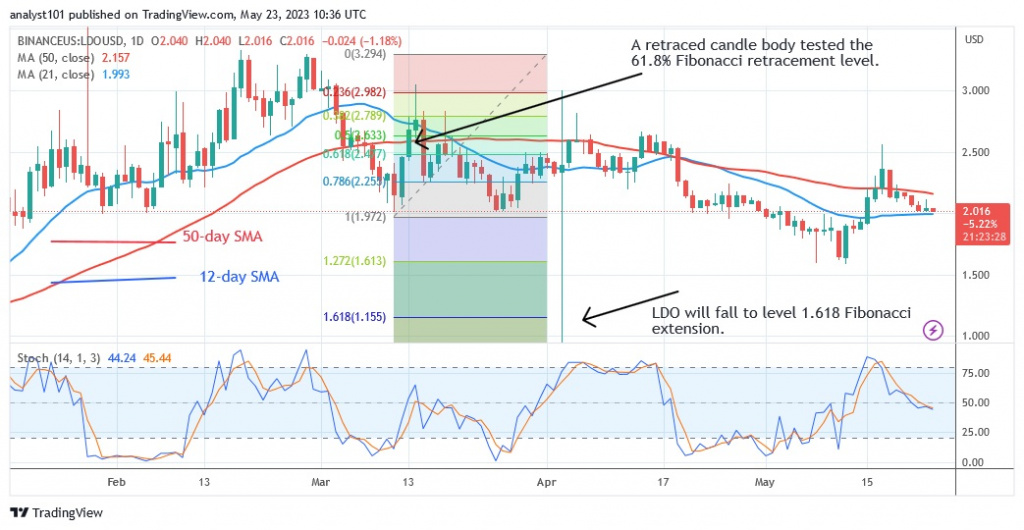
Although it is declining, Lido DAO (LDO) is making an upward correction. The cryptocurrency asset crossed the moving averages lines but was rejected. It is currently trapped between the moving average lines. Meanwhile, the price signal suggests that the cryptocurrency will continue its downward trend. At the time of writing, the price is at $2.01. LDO completed an upward correction during the March 11 decline, and a candlestick tested the 61.8% Fibonacci retracement level. After the correction, LDO will fall below the $1.15 level of the 1.618 Fibonacci extension. LDO is currently between the moving average lines. Selling pressure will resume if the bears break below the 21-day line SMA. The daily stochastic is at the 50 level, which is a bearish momentum threshold for the altcoin. It has the following characteristics: It has the following characteristics:
Current price: $1.99
Market capitalization: $1,987,566,762
Trading volume: $37,615,228
7-day gain/loss: 10.01%
WOO Network
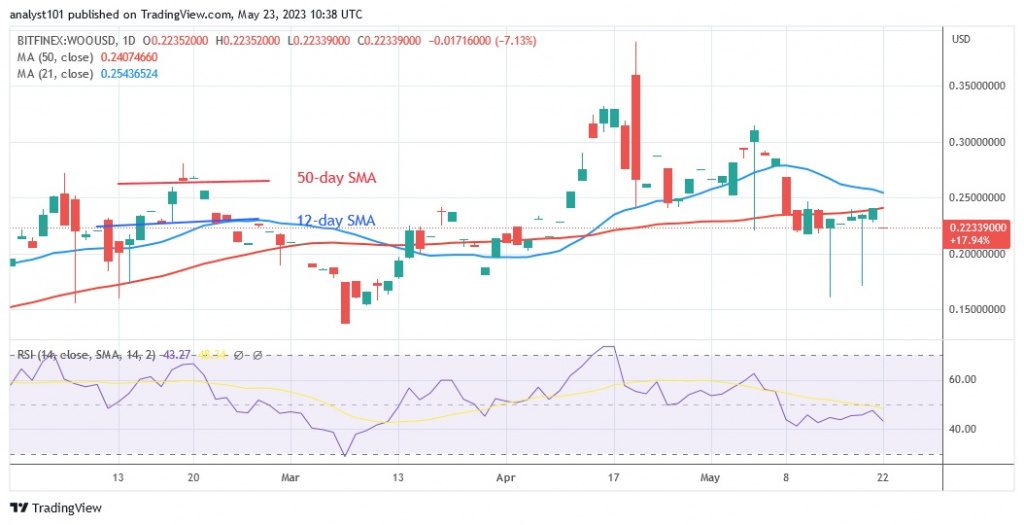
WOO Network (WOO) stock price is falling below the moving average lines. Above the $0.21 support, the altcoin fell and started consolidating again. The downward long candle tails are in place. This indicates that prices are falling and there is significant buying pressure. If the current support holds, the altcoin will rise. At this point, the altcoin is worth $0.22. WOO will rise to its previous high of $0.38. However, if the cryptocurrency loses its current support, it will lose value. The market price will fall to a low of $0.15. For the period 14, WOO is at level 43 on the Relative Strength Index. It is in a zone of downtrend and may deteriorate further. WOO is the third worst cryptocurrency. It has the following characteristics:
Current price: $0.2090
Market capitalization: $471,012,223
Trading volume: $23,760,735
7-day gain/loss: 9.81%
GMX
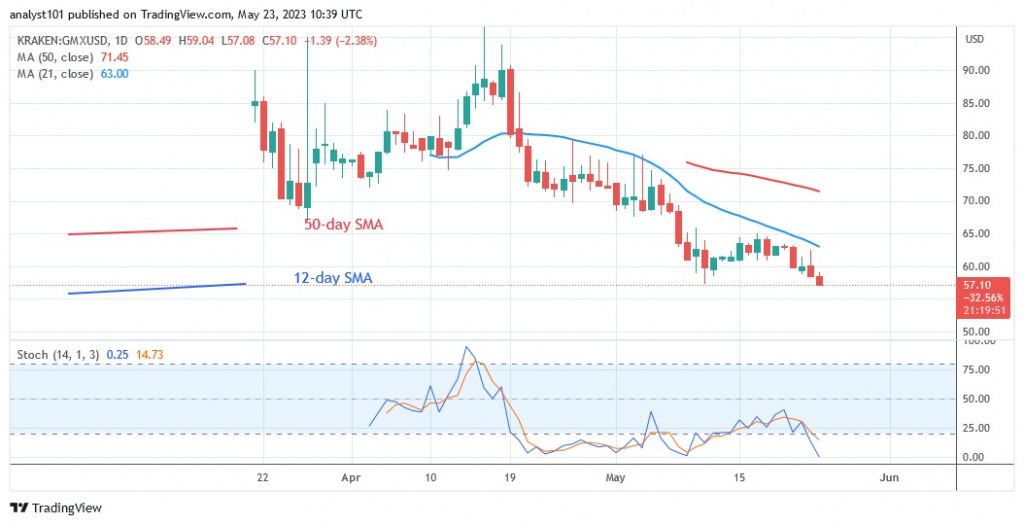
The price of GMX (GMX) is falling below the moving average lines. The cryptocurrency value has dropped dramatically and has broken the level of the existing support of $60. The altcoin is falling as buyers are unable to maintain positive momentum above the $90 high. The cryptocurrency is currently trading at $56. Meanwhile, GMX has entered the oversold zone of the market. The daily stochastic is currently below the 20 level, and as the price moves into the oversold area, the selling pressure is likely to ease. GMX is currently the fourth worst cryptocurrency. It has the following characteristics:
Current price: $56.09
Market capitalization: $517,557,928
Trading volume: $19,760,453
7-day gain/loss: 9.08%
Decentraland
The price of Decentraland (MANA) has fallen below its moving average lines. The crypto asset is under selling pressure again as it is rejected at $0.70. As investors bought dips, the altcoin fell to a low of $0.44. The coin has started to correct back up, but the 21-day line SMA has rejected it. At the time of writing, MANA is currently trading at $0.46. If MANA turns down at the current high, it could fall to its previous low of $0.30. MANA is moving in the wrong direction and is below the daily Stochastic threshold of 50. The altcoin with the following characteristics is the fifth worst performing cryptocurrency:
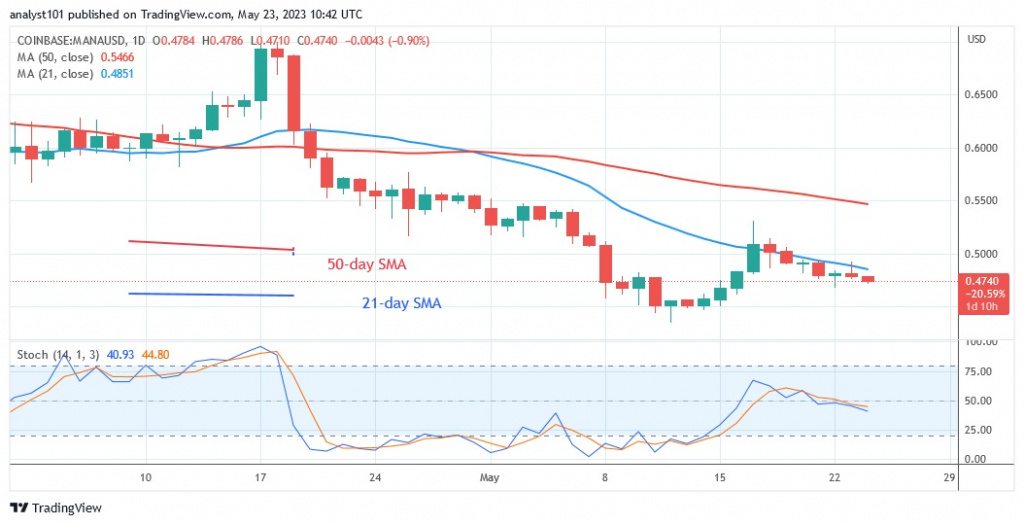
Current price: $0.4672
Market capitalization: $1,024,116,774
Trading volume: $40,835,579
7-day gain/loss: 7.45%
Disclaimer. This analysis and forecast are the personal opinions of the author and are not a recommendation to buy or sell cryptocurrency and should not be viewed as an endorsement by CoinIdol. Readers should do their own research before investing in funds.
Price
Price
Price
Price
Price

(0 comments)