XRP Is In An Overbought Zone And Is Trading Below $1.60
Updated: Nov 24, 2024 at 22:31

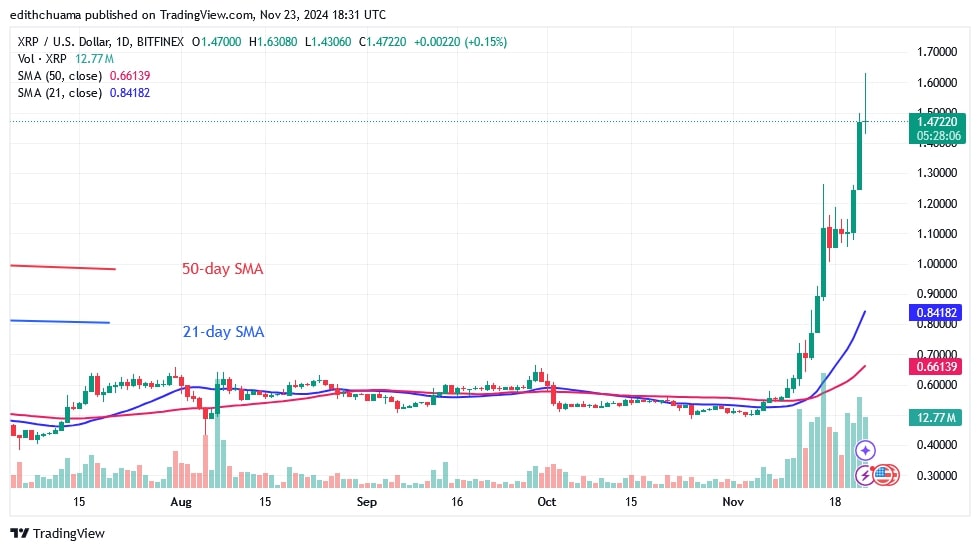
XRP's bullish momentum peaked at $1.60 but has since retraced back above the $1.50 support.
XRP long term analysis: bullish
The price of Ripple or XRP (XRP) coin has rallied significantly and reached the historical price level of May 1, 2021, as Coinidol.com wrote. The cryptocurrency rose to a high of $1.60 before falling again. During the last rally, the altcoin reached a high of $1.26 before falling above the $1.00 support on November 17. Buyers recovered above the $1.00 support level before resuming the uptrend.
XRP has reached the overbought zone of the market. If sellers appear on the overbought market, the altcoin will fall in value. In other words, if the altcoin falls back below the $1.26 support, XRP will fall. The altcoin is currently valued at $1.46.
XRP indicator analysis
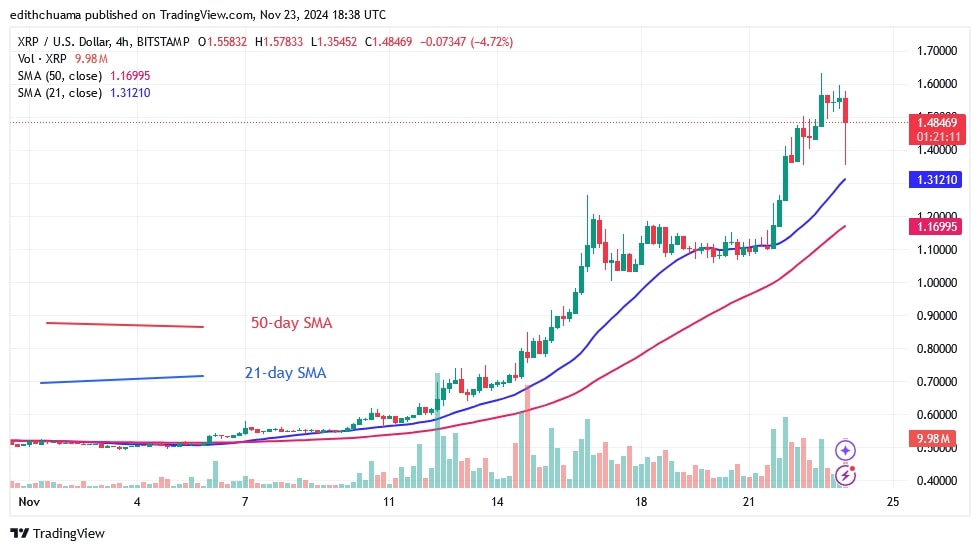
The horizontal moving average lines are moving upwards. The moving average lines are showing a bullish crossover, indicating that the cryptocurrency is in an uptrend. On the 4-hour chart, the price of the cryptocurrency is bouncing above the 21-day SMA, indicating that the uptrend is still intact. The price action has been delayed due to the Doji candlesticks.
Technical indicators:
Resistance Levels – $1.40 and $1.60
Support Levels – $1.00 and $0.80

What is the next direction for XRP?
On the 4-hour chart, XRP was in an uptrend and rose to $1.63. Since November 23, the uptrend has stalled at its peak. XRP is forced to move in a range above the moving average lines but below the $1.60 level. The long candlestick tail above the 21-day SMA indicates significant buying pressure above the moving average lines.

Disclaimer. This analysis and forecast are the personal opinions of the author. They are not a recommendation to buy or sell cryptocurrency and should not be viewed as an endorsement by CoinIdol.com. Readers should do their research before investing in funds.
News
Price
News
Price
Price

(0 comments)