XRP Price Remains Stable After Breaking Below The $0.58 Support Level
Updated: Aug 15, 2024 at 14:05

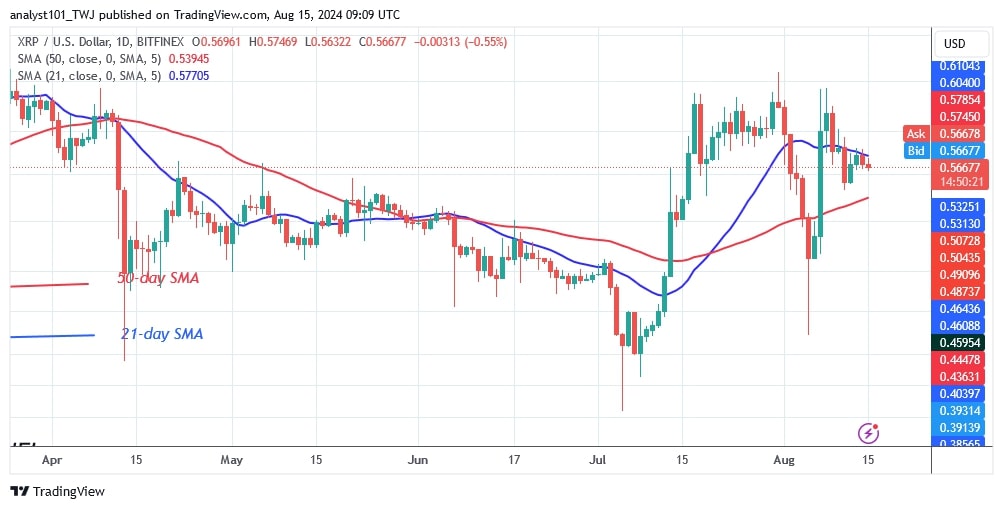
The XRP or Ripple (XRP) coin price is declining and is in a sideways trend. The rising price trend has been held back by the overarching resistance of $0.64 since July 17.
Long-term analysis: fluctuating
Buyers were rebuffed three times when they tried to sustain the upside momentum above the $0.64 high.
Nevertheless, the altcoin has been bearish since August 9 and has fallen below the 21-day SMA while holding above the 50-day SMA. A barrier at the 21-day SMA has prevented buyers from sustaining their upside momentum for the past seven days. XRP is moving lower and approaching the support of the 50-day SMA. If the bears break the 50-day SMA support, the cryptocurrency will drop much lower to $0.48.
However, the altcoin will remain trapped if the 50-day SMA support zone holds. XRP is now worth $0.56.
XRP indicator analysis
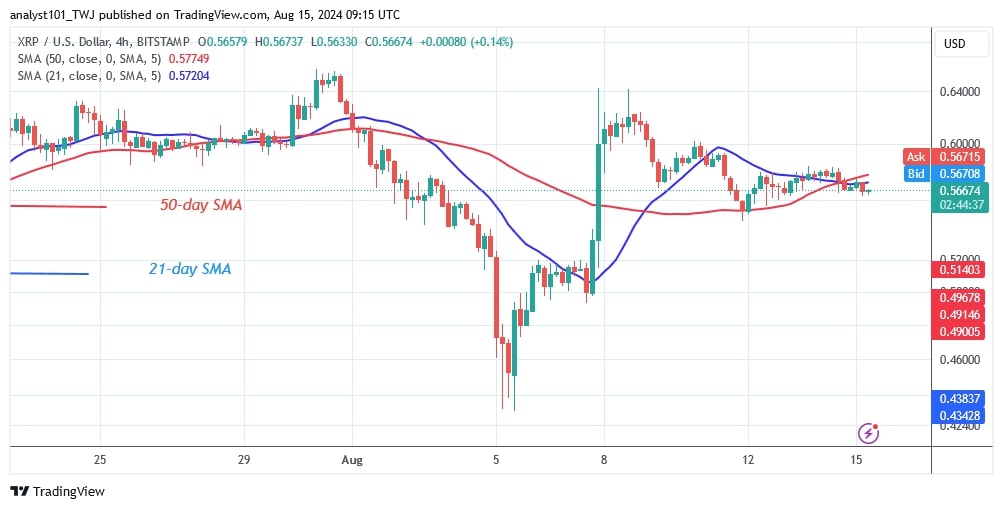
The price of the cryptocurrency remained steady as it dipped between the moving average lines. The appearance of doji candlesticks has kept the price movement to a minimum. The moving average lines are horizontal as the price range is between $0.41 and $0.48.
Technical indicators:
Key Resistance Levels – $0.80 and $1.00
Key Support Levels – $0.40 and $0.20

What is the next direction for XRP?
The price of XRP continues to move in a range between $0.41 and $0.64. Nevertheless, the altcoin's price has fallen between the 21-day SMA ($0.58) and the 50-day SMA ($0.54). XRP will resume the trend if the moving average lines are breached.
In the meantime, the price action is stagnant as it is above the $0.56 support.

Last week XRP has fallen below the moving average lines after buyers failed to keep it above the $0.64 resistance level, as reported by Coinidol.com.
Disclaimer. This analysis and forecast are the personal opinions of the author. They are not a recommendation to buy or sell cryptocurrency and should not be viewed as an endorsement by CoinIdol.com. Readers should do their research before investing in funds.
Price
News
Price
Price
Price

(0 comments)