XRP Recovers But Faces The Obstacle Of $0.55
Updated: Nov 03, 2024 at 13:35

Ripple (XRP) price is in a sideways trend and trading below the moving average lines. Price analysis by Coinidol.com.
XRP long-term analysis: ranging
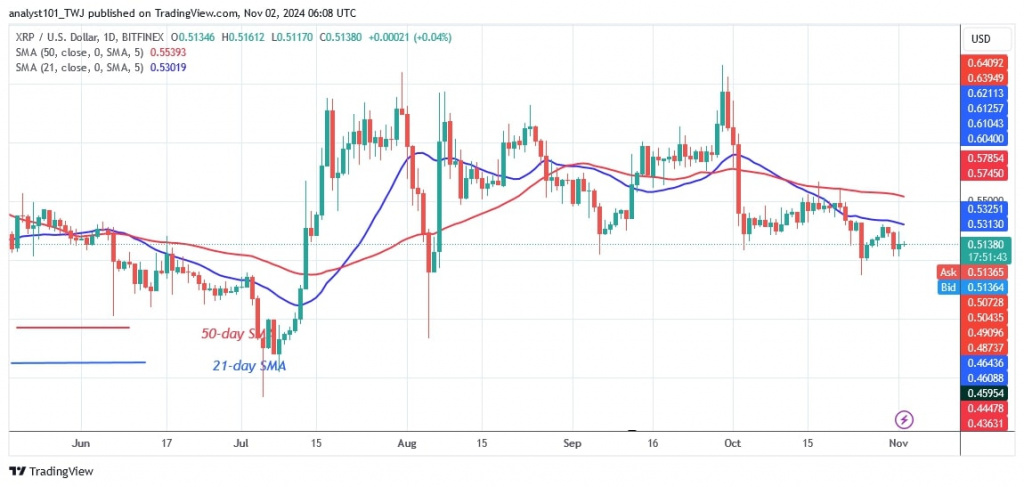
Since October 3, the cryptocurrency has been trading above the support level of $0.50, but below the moving average lines. On October 25, the bears broke below the $0.50 support level, but the bulls bought the dips, according to Coinidol.com.
Now, the price range is limited to the area around the $0.50 support and below the 21-day SMA resistance.
XRP is traded in a narrow range. The presence of doji candlesticks has caused the price movement to remain stationary. The doji candlesticks are consolidating above $0.50 and below the moving average lines.
On the upside, XRP will rise above the moving average lines if it recovers from the $0.50 support. The positive momentum will continue to the high of $0.65.
XRP indicator analysis
The price bars are below the moving average lines and the 21-day SMA serves as resistance for the price bars. The moving average lines are sloping horizontally, but the 21-day SMA is lower than the 50-day SMA, indicating selling pressure. Meanwhile, the price bars have consolidated above the current support level.
Technical indicators:
Major Resistance Levels – $0.80 and $1.00
Major Support Levels – $0.40 and $0.20

What Is the Next Direction for XRP?
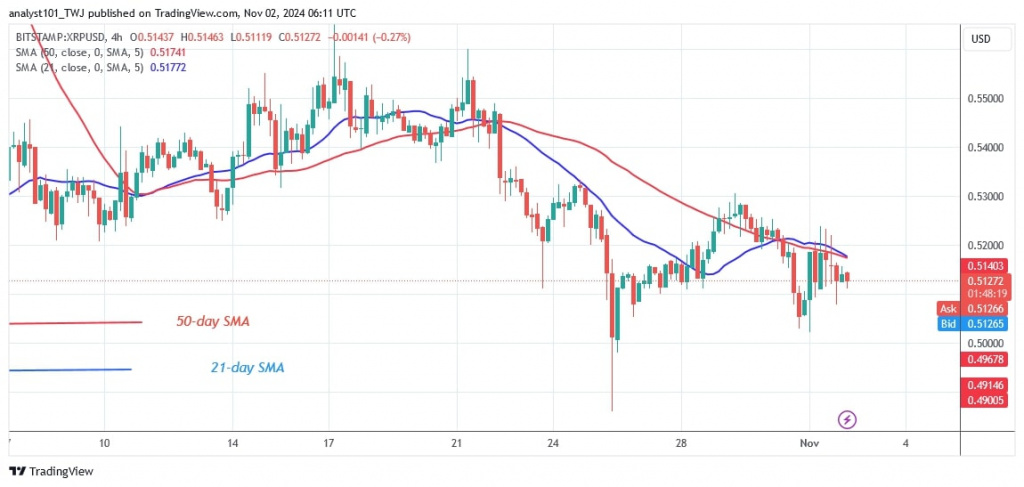
On the 4-hour chart, XRP is currently trading in a narrow range of $0.50 to $0.53. The altcoin is trading below its moving average line. The moving average lines have put the brakes on the uptrend. The price of the cryptocurrency is oscillating above the current support and below the moving average lines.

Disclaimer. This analysis and forecast are the personal opinions of the author. They are not a recommendation to buy or sell cryptocurrency and should not be viewed as an endorsement by CoinIdol.com. Readers should do their research before investing in funds.
News
Price
Price
News
Price

(0 comments)