XRP Moves Sideways Above The $0.50 Low

The price of the Ripple coin (XRP) has maintained a sideways pattern, trading above the $0.50 support but below the moving averages.
XRP long-term analysis: ranging
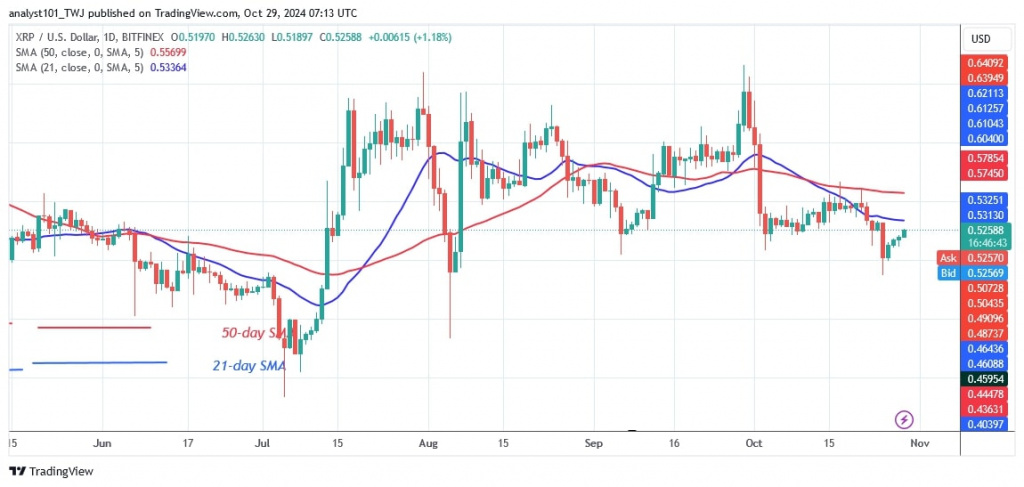
On October 25, the bears broke below the $0.50 support but recovered above it. Now, XRP is correcting upwards as it approaches the moving average lines. A break above the moving average lines would take the price to a high of $0.56 and it will reach a high of $0.65. However, if the altcoin deviates from the moving average lines, it will decline. XRP will test its previous lows of $0.47 and $0.43. It is currently worth $0.52.
XRP indicator analysis
Since October 2, the price bars have remained below the horizontal moving average lines. This indicates a continued depreciation of the cryptocurrency. The 21-day SMA acts as resistance for the price bars. In addition, doji candlesticks dominate the price action. This means that the price movement is stationary.
Technical indicators:
Key Resistance Levels – $0.80 and $1.00
Key Support Levels – $0.40 and $0.20

What is the next direction for XRP?
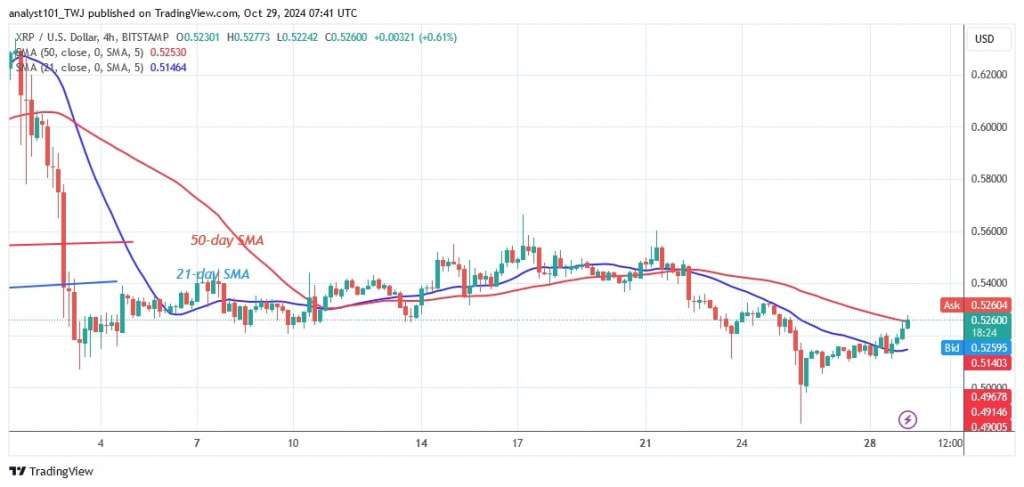
The 4-hour chart shows XRP in a sideways trend above the support level of $0.50. The cryptocurrency is moving between the support level of $0.50 and the resistance level of $0.56. The sideways trend will continue as the altcoin is trapped between the moving average lines. XRP will rally if buyers keep the price above the 50-day moving average. The price will drop again once it falls back below the 21-day moving average line.

Disclaimer. This analysis and forecast are the personal opinions of the author. They are not a recommendation to buy or sell cryptocurrency and should not be viewed as an endorsement by CoinIdol.com. Readers should do their research before investing in funds.
Price
News
Price
News

(0 comments)