XRP Continues To Move Below The $0.64 Barrier

Ripple coin or XRP (XRP) price has maintained its sideways trend above the moving average lines.
XRP long-term analysis: fluctuating
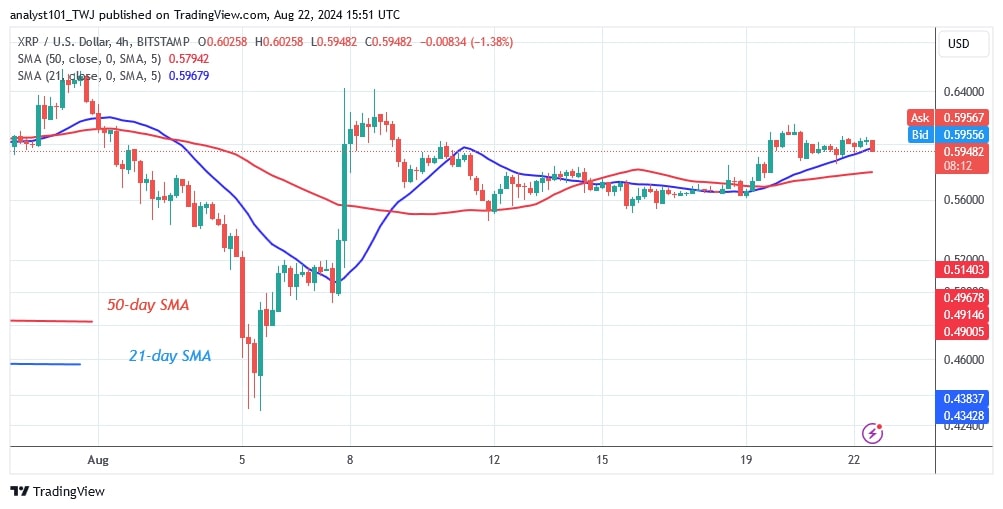
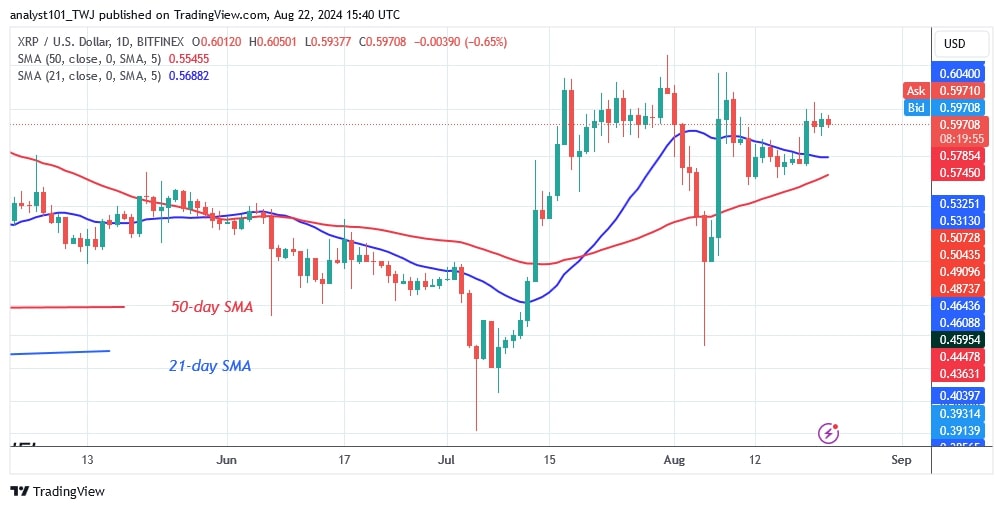
Since July 17, as reported before by Coinidol.com, the price of the cryptocurrency has broken above the moving average lines three times but has been unable to sustain its positive momentum above the $0.64 resistance.
The cryptocurrency is now bouncing and trading below the resistance zone. There are long candlestick wicks indicating the overhead resistance. These candlestick wicks indicate strong selling pressure at the overarching resistance level of $0.64. However, should the bulls break through the barrier at $0.64, the market will rise to a high of $0.74.
On the other hand, the sideways trend will continue above the moving average lines where buyers are unable to break the $0.64 barrier. At the time of writing, XRP is currently worth $0.60.
XRP indicator analysis
On both charts, the price bars are above the horizontal moving average lines. Doji candlesticks on the 4-hour chart have caused the price action to remain static. Doji candlesticks symbolize traders who are uncertain about the direction of the market.
Technical indicators:
Key Resistance Levels – $0.80 and $1.00
Key Support Levels – $0.40 and $0.20

What is the next direction for XRP?
XRP price is consolidating above the $0.56 support and continues to move in a range. The price movement is marginal due to the existence of small-scale indecisive candles, known as doji candles. The altcoin will remain range-bound for a few more days as doji candles dominate the price action.

Disclaimer. This analysis and forecast are the personal opinions of the author. They are not a recommendation to buy or sell cryptocurrency and should not be viewed as an endorsement by CoinIdol.com. Readers should do their research before investing in funds.
Price
Price
News
Price
Price

(0 comments)