Ripple Holds Above The Breakthrough Level Of $0.41
Updated: Nov 01, 2022 at 12:55

The price of Ripple (XRP) is in a sideways movement between the moving average lines.
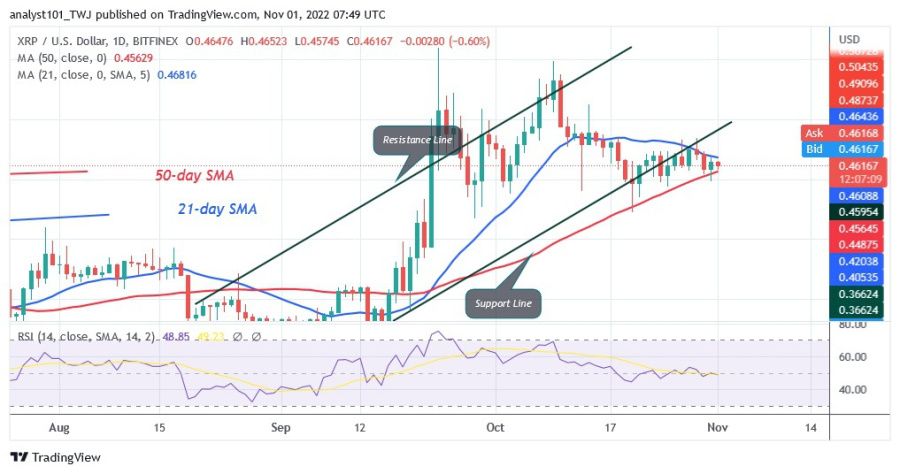
The cryptocurrency has been trapped between the moving average lines since October 20. The advantage was with sellers, who drove the altcoin to a low of $0.46. Buyers have a chance to hit a high of $0.54 another time.
Long-term forecast for the Ripple price: bullish
However, the price battle between the moving average lines continues. On the downside, XRP will fall to a low of $0.35 if sellers drop below the 50-day line SMA. Similarly, the market will rise to its previous high of $0.54 if buyers keep the price above the 21-day line SMA. XRP/USD is currently trading at $0.46 at the time of writing this article.
Ripple indicator analysis
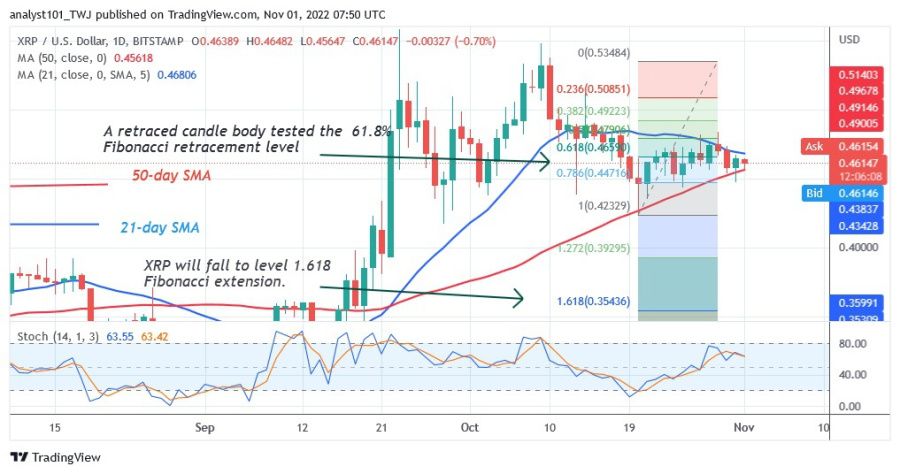
Ripple is at level 49 according to the 14th period of the Relative Strength Index, which means that there is a balance between supply and demand. Depending on how long the price bars stay between the moving average lines, Ripple could return to a trading range. XRP is moving up above the 60% range of the daily stochastic.

Technical Indicators:
Key resistance levels - $0.80 and $1.00
Key support levels - $0.40 and $0.20
What is the next move for Ripple?
If the price of Ripple (XRP) does not cross the 21-day line SMA, it could possibly fall. In the meantime, XRP has reversed the downtrend that started on October 20 and a candlestick has tested the 50% Fibonacci retracement level. The correction predicts that XRP will fall to the 1.618 Fibonacci extension level or $0.35.

Disclaimer. This analysis and forecast are the personal opinions of the author and are not a recommendation to buy or sell cryptocurrency and should not be viewed as an endorsement by CoinIdol. Readers should do their own research before investing
News
Price
News
Price
Price

(0 comments)