TRON Is Holding Above $0.16 And Remains In An Uptrend
Updated: Oct 28, 2024 at 14:01

TRON (TRX) price has continued its uptrend as it trades above the moving average lines. TRX price analysis by Coinidol.com.
Long-term forecast for TRX price: bullish
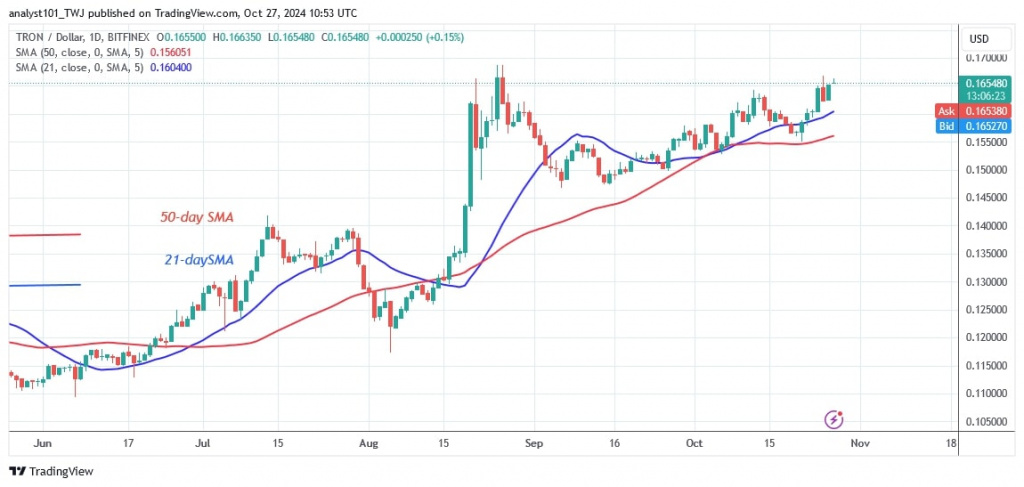
The previous uptrend has stalled above the $0.17 level since August 26, as Coinidol.com wrote. This led to the current sideways trend.
Today, the altcoin reached a high of $0.166, which is close to the $0.17 resistance level. However, over the past two months, buyers have not been able to sustain the positive momentum above $0.17.
On the upside, price action has been minimal due to the formation of doji candlesticks. Doji candlesticks indicate that traders are uncertain about the direction of the market. TRON is stabilizing above the moving average lines, but the barrier is at $0.17. The cryptocurrency is currently worth $0.164.
TRON indicator analysis
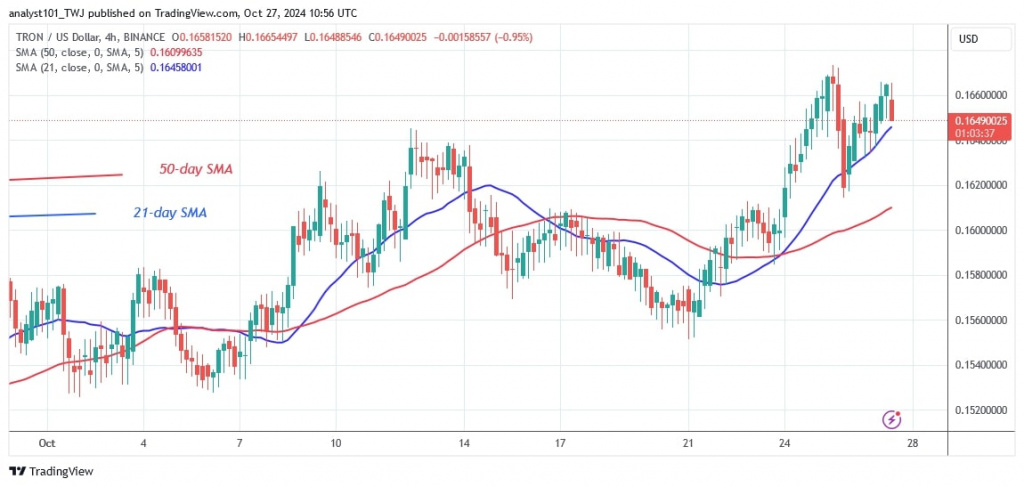
The moving average lines on the daily chart are horizontal and indicate a sideways trend. On the 4-hour chart, the moving average lines are sloping north, indicating an uptrend. The price action is characterized by doji candlesticks, which slow down the price movement.
Technical Indicators
Key Resistance Zones: $0.13, $0.14, and $0.15
Key Support Zones: $0.10, $0.09, and $0.08

What is the next move for TRON?
On the 4-hour chart, TRON is in an uptrend, but it was halted at the high of $0.17. Since October 25, the altcoin has been fluctuating above the moving average lines but below the $0.15 resistance level. The uptrend will continue if TRON finds support above the moving average lines.
Disclaimer. This analysis and forecast are the personal opinions of the author. They are not a recommendation to buy or sell cryptocurrency and should not be viewed as an endorsement by CoinIdol.com. Readers should do their research before investing in funds.
News
Price
News
Price
Price


(0 comments)