TRON Falls Above $0.110 And Resumes Its Horizontal Trend

The price of TRON (TRX) is in a sideways trend, trading above $0.11 but below $0.126. Price analysis by Coinidol.com.
Long-term prediction of the TRON price: range
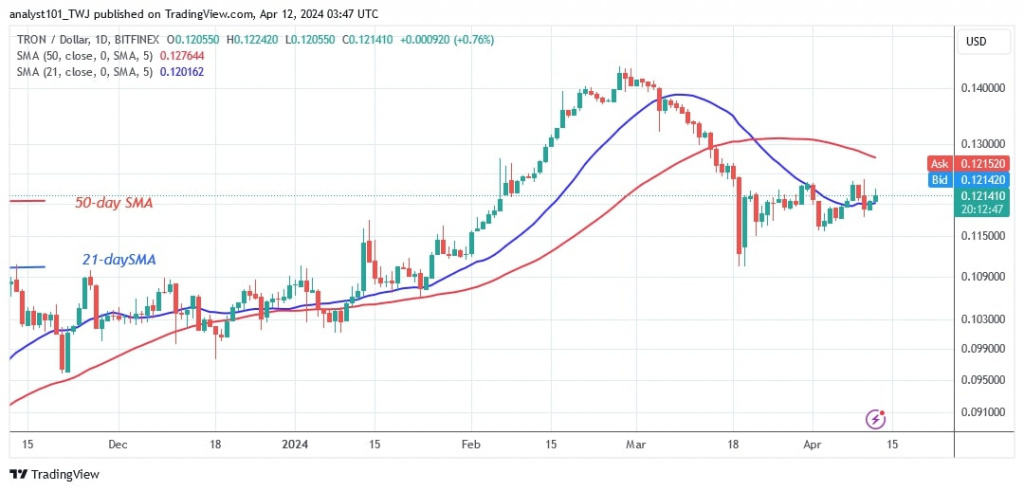
The price of the cryptocurrency has been trading in a range since breaking above the 21-day SMA. If buyers sustain their bullish momentum above the 50-day SMA, TRON will resume its uptrend. The cryptocurrency will rise to its previous high of $0.144.
On the other hand, if the bears breach the support level of $0.11, the altcoin will drop to a low of $0.10. Meanwhile, TRON is trading at $0.121 at this time.
TRON indicator analysis
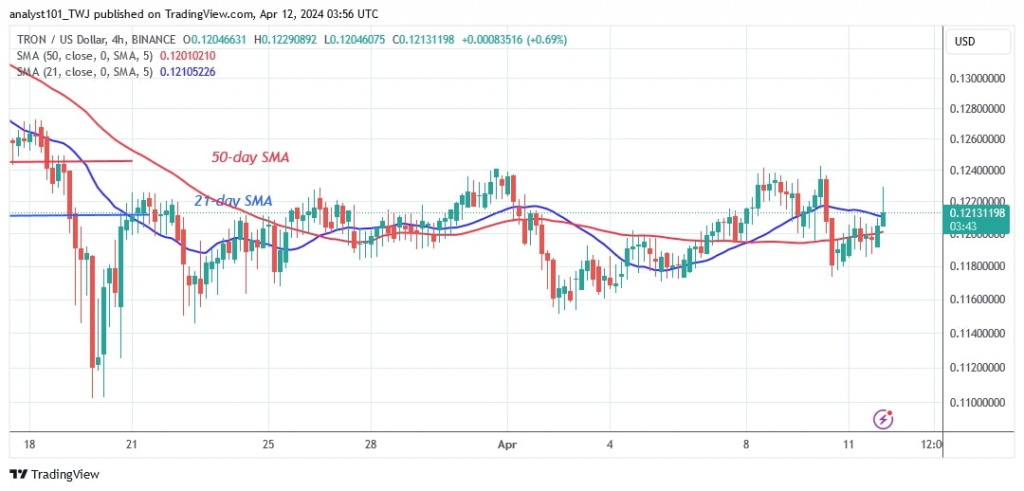
TRON price bars have risen above the 21-day SMA and are approaching the 50-day SMA. The bullish momentum will continue if the 50-day SMA is breached. The altcoin will be forced to trade in a range between the moving average lines as long as the 21-day SMA and the 50-day SMA remain unbroken. The 4-hour chart of the altcoin shows a horizontal trend.
Technical indicators
Key supply zones: $0.09, $0.10, $0.11
Key demand zones: $0.06, $0.05, $0.04

What is TRON's next move?
On the 4-hour chart, the cryptocurrency is moving in a narrow range of $0.116 to $0.124. Doji candlesticks dominate the price activity. Doji candlesticks indicate the trader's indifference to the market direction.

Disclaimer. This analysis and forecast are the personal opinions of the author and are not a recommendation to buy or sell cryptocurrency and should not be viewed as an endorsement by CoinIdol.com. Readers should do their research before investing in funds.
News
News
Coin expert

(0 comments)