TRON Faces A Decline In The Overbought Zone Of $0.126

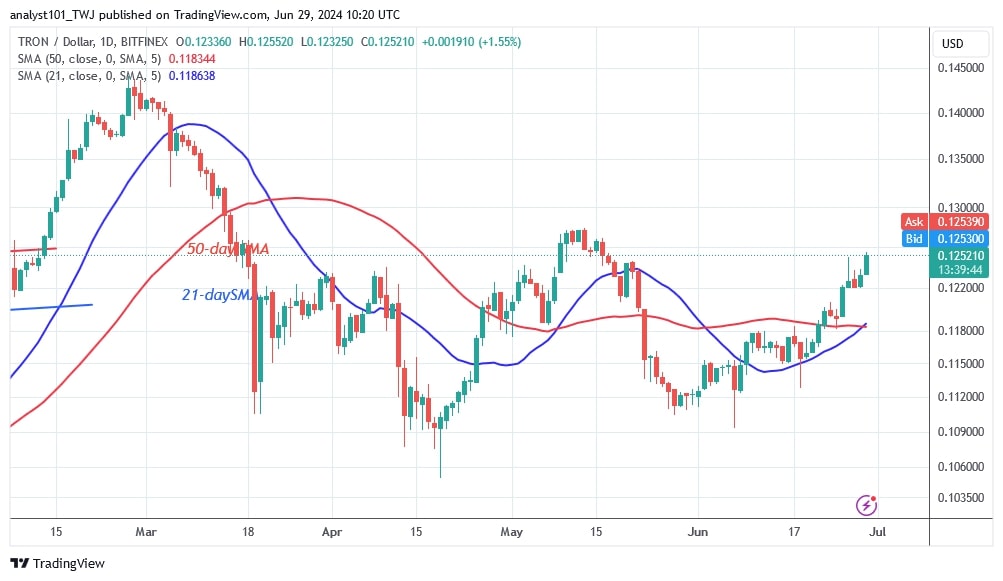
The price of TRON (TRX) broke above the moving average lines on June 22. Since the breakout, the cryptocurrency has gained in value. Price analysis by Coinidol.com.
TRON price long-term forecast: bullish
On the upside, TRON will rally and return to its previous highs of $0.125 and $0.127. In the last price activity on May 13, buyers pushed the altcoin to a high of $0.127 before being rejected. In other words, the buyers failed to hold the resistance zone above $0.128.
Should the $0.127 barrier be broken to the upside, the market will rise to a high of $0.14. Nevertheless, TRON could fall and move between the support at $0.118 and the resistance level of $0.127 where buyers failed to break the recent high. TRON is currently trading at $0.125.
TRON indicator reading
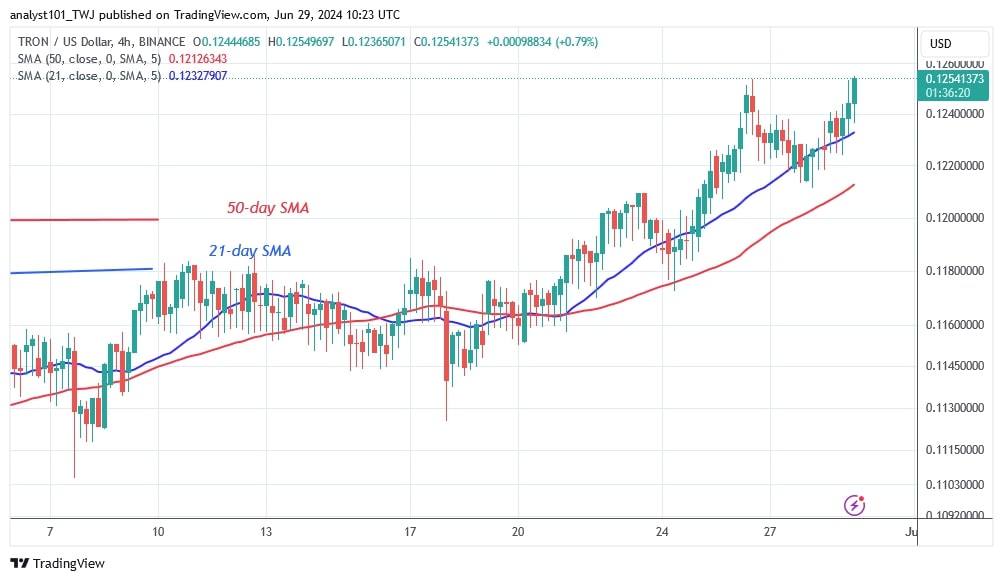
TRON is in an uptrend with the price bars above the moving average lines. On the 4-hour chart, the price bars are above the moving average lines, but the price is fluctuating between higher highs and higher lows. The 21-day SMA is a support line for the altcoin's growth.
Technical Indicators
Key supply zones: $0.13, $0.14, $0.15
Key demand zones: $0.10, $0.09, $0.08

What's next for TRON?
On the 4-hour chart, the altcoin has started to rise. It is currently approaching the previous high of $0.126. On June 26, TRON reached a high of $0.125 and was pushed back. Today it is approaching the resistance level. The rise will continue if the initial barrier is broken.

Disclaimer. This analysis and forecast are the personal opinions of the author. They are not a recommendation to buy or sell cryptocurrency and should not be viewed as an endorsement by CoinIdol.com. Readers should do their research before investing in funds.
Price
Price
Price
Price
News

(0 comments)