TRON Continues To Rise And Remains Above $0.17
Updated: Nov 16, 2024 at 11:06

TRON (TRX) price has maintained its uptrend by staying above the moving average lines. Price analysis by Coinidol.com.
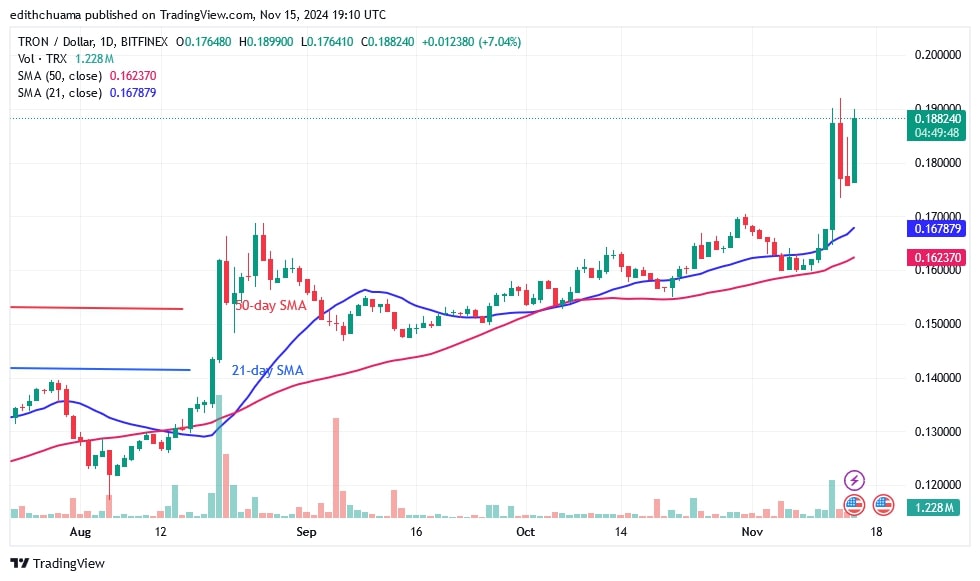
Long-term forecast for the TRX price: bullish
Since August 26, the uptrend has stalled at the $0.17 resistance level, forcing the altcoin into a sideways trend, as reported by Coinidol.com. The altcoin traded above the moving average lines but below the $0.17 resistance level.
On November 12, the bulls broke through the resistance and reached a high of $0.19. The price is trading above the $0.17 support and below the $0.19 resistance as the positive momentum pauses again near the recent high. Nevertheless, the altcoin is predicted to reach a high of $0.20 if the current barrier is breached; at the time of writing, TRON is trading at $0.18.
TRX indicator analysis
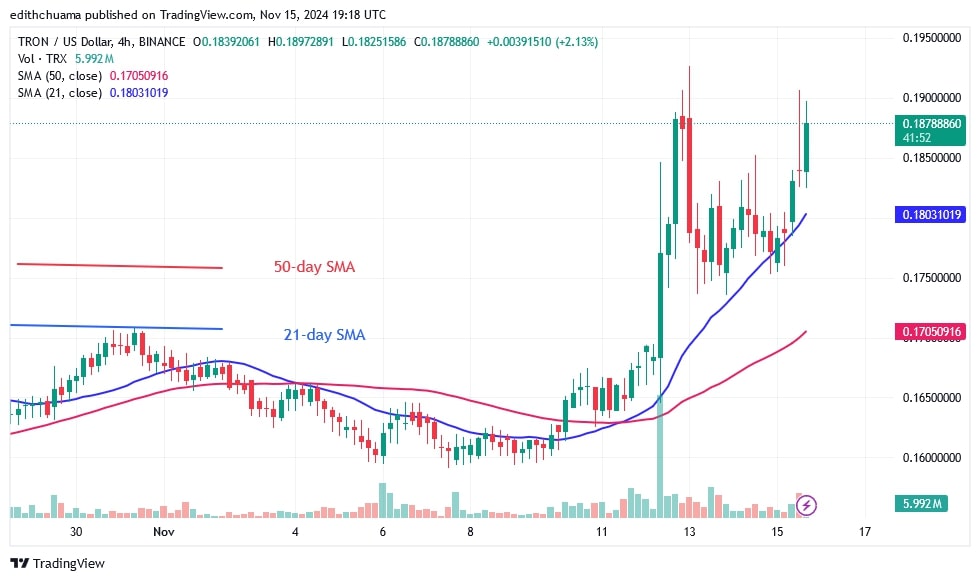
The moving average lines are moving north while the price bars remain above them. On the 4-hour chart, extended candlestick wicks point to the recent high. This indicates strong selling pressure at the recent high. Doji candlesticks have slowed the price movement.
Technical Indicators
Key Resistance Zones: $0.13, $0.14, and $0.15
Key Support Zones: $0.10, $0.09, and $0.08

What is the next move for TRON?
On the 4-hour chart, TRON has been moving sideways since November 12. Today, the bulls are trying to break the barrier at $0.19. Last week, the altcoin traded below its recent high in anticipation of a positive trend. TRON is falling after experiencing another sharp rejection at its recent high.

Disclaimer. This analysis and forecast are the personal opinions of the author. They are not a recommendation to buy or sell cryptocurrency and should not be viewed as an endorsement by CoinIdol.com. Readers should do their research before investing in funds.
News
Price
News
Price
Price

(0 comments)