Toncoin Continues Its Range Above The $5.00 Support
Updated: Jan 07, 2025 at 12:23

The price of Toncoin (TON) is moving above the $5.00 support but below the moving average lines. Cryptocurrency price analysis brought by Coinidol.com.
TON price long-term forecast: bearish
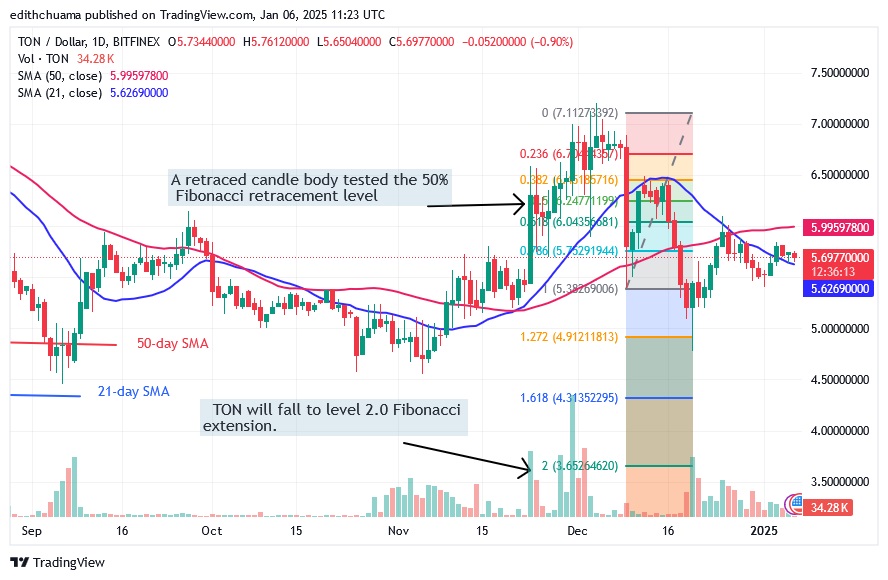
TON slipped to a low of $4.78 despite bulls buying the dips. The altcoin has rallied above the $5.00 support level but buyers have been unable to sustain the price above the moving average lines. Yesterday, the bulls broke through the 21-day SMA resistance and the altcoin moved between the moving average lines.
According to the previous price forecast, TON is expected to drop to the 2.0 Fibonacci extension level or $3.65. However, the bulls are holding on to the $5.00 support.
Now, the price of the cryptocurrency is trapped between the moving average lines and TON will move once the moving average lines are broken. TON is consolidating its 21-day SMA support. It will fall once the 21-day SMA support is breached and will first drop to its previous low of $5.00.
Toncoin indicator analysis
The price bars are located between the moving average lines, which indicates a rangebound movement for the cryptocurrency. Doji candlesticks cause the price bars to move steadily. The moving average lines are sloping horizontally, indicating a sideways trend.

Technical Indicators
Resistance Levels: $6.00, $8.00, $10.00Support Levels: $5.00, $3.00, $1.00
What's next for Toncoin?
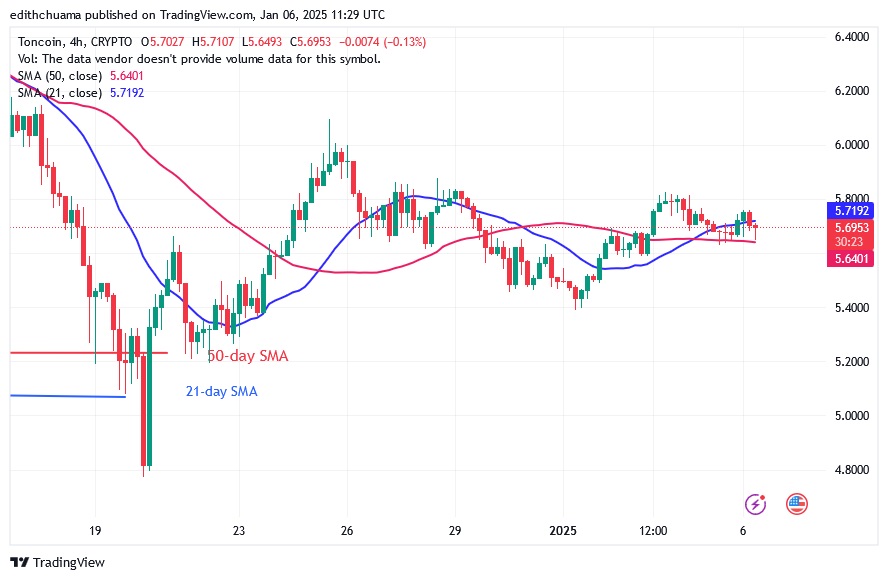
On the 4-hour chart, the altcoin is trading in a narrow range between $5.40 and $5.80. The uptrend is being held back by resistance at $5.80. There are long candlestick wicks heading towards the high of $5.80. The extended candlestick wicks signal significant selling pressure at the recent high.
Nonetheless, the altcoin will remain in a trading range as it is trapped between the moving average lines.

Disclaimer. This analysis and forecast are the personal opinions of the author. They are not a recommendation to buy or sell cryptocurrency and should not be viewed as an endorsement by CoinIdol.com. Readers should do their research before investing in funds.
News
Price
Price
News
Coin expert

(0 comments)