Tezos Resumes an Uptrend; Can Bulls Break the $3.50 Price Level?
Updated: Feb 07, 2021 at 14:31

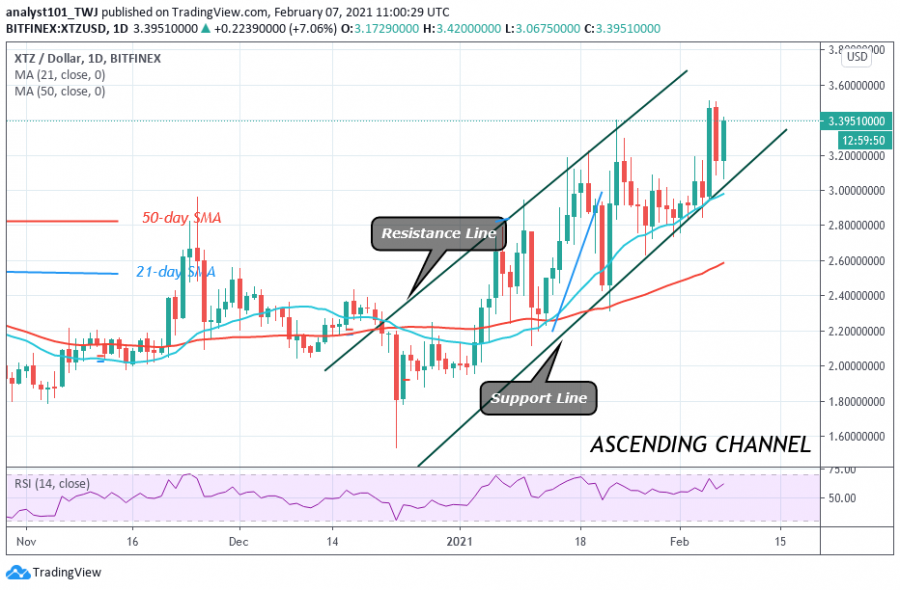
Tezos has been making an upward move but it is facing resistance at $3.50 high. The candlesticks are indicating long wicks. This implies that there is strong selling pressure at the $3.50 resistance zone. In a similar price action, on February 5 and 6, the bulls were repelled as XTZ slumped to $3.10 low.
After two days of correction, Tezos resumed an upward move. On the upside, if the bulls break the resistance at $3.50, the price will rally above $4.00. Nevertheless, if the bulls fail to break the current resistance level, the crypto currency will continue a range-bound movement between levels $3.10 and $3.50. Presently, XTZ is trading at $3.396 at the time of writing.
Tezos indicator reading
XTZ is at level 62 of the Relative Strength Index period 14. It indicates that the market is approaching level 70, the overbought region. The altcoin may not have enough room to rally on the upside. Tezos is also above the 65% range of the daily Stochastic. It indicates that the market is in a bullish momentum.

Technical indicators:
Major Resistance Levels – $4.50 and $5.00
Major Support Levels – $2.50 and $2.0
What is the next direction for Tezos?
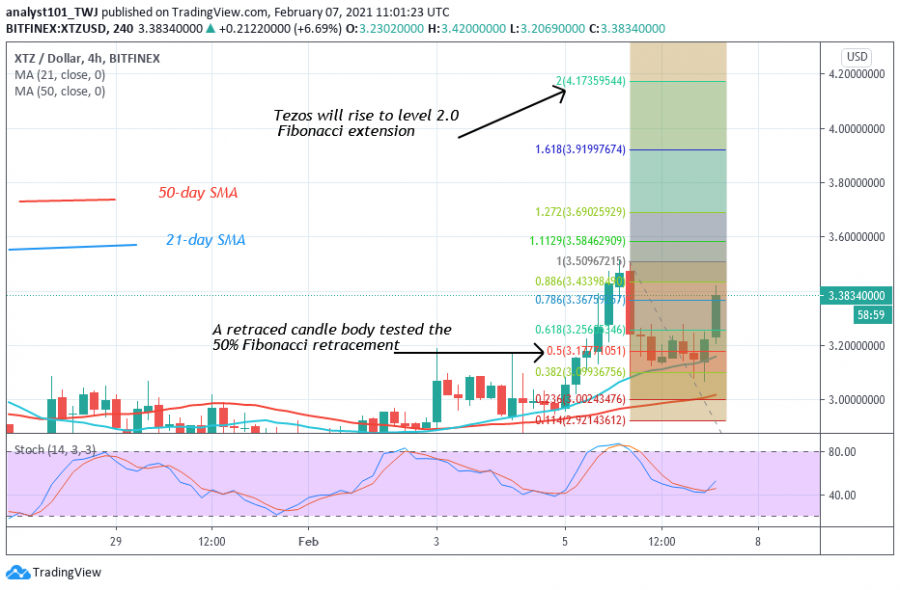
Tezos (XTZ) is making an upward move on the upside. On February 5 uptrend; a retraced candle body tested the 50 % Fibonacci retracement level. This indicates that the market will rise to level 2.0 Fibonacci extension. That is, high of $4.17.

Disclaimer. This analysis and forecast are the personal opinions of the author that are not a recommendation to buy or sell cryptocurrency and should not be viewed as an endorsement by Coin Idol. Readers should do their research before investing funds.
Price
News
News
Coin expert

(0 comments)