Solana Trades Marginally In A Narrow Range Below $22
Updated: Apr 02, 2023 at 15:06

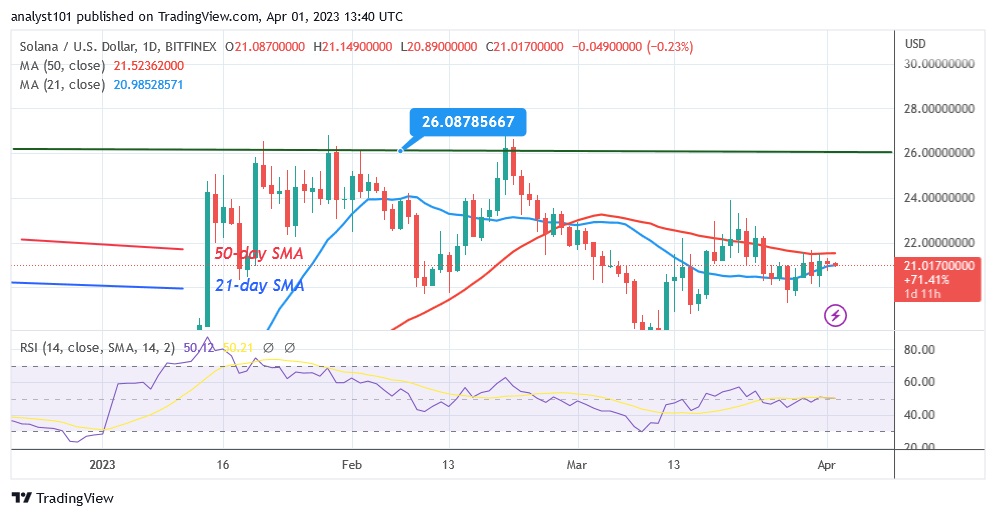
Solana (SOL) price has been fluctuating indecisively since January 14. The uptrend was stopped at the $26 high, which led to a sideways movement.
Solana price long-term forecast: bullish
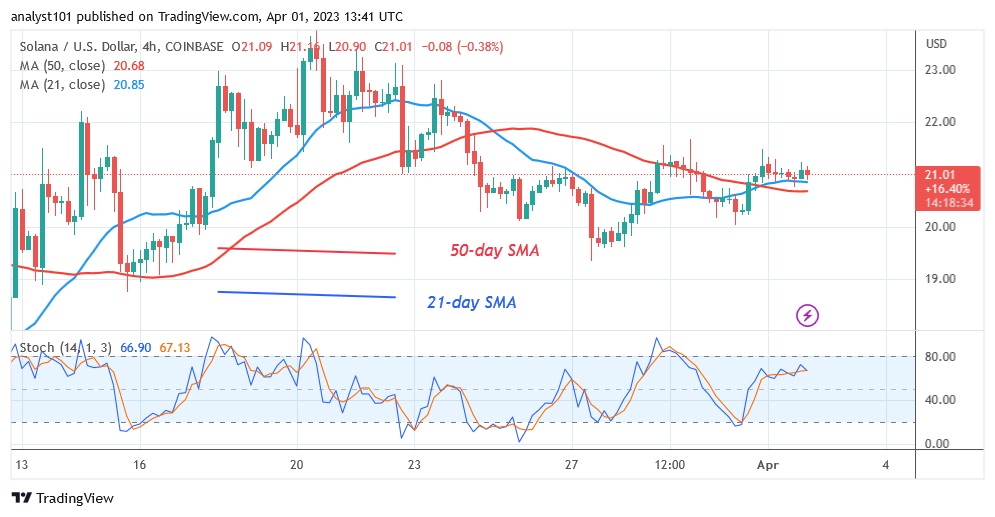
Despite today's market decline, Solana is limited by the moving average lines. The value of the cryptocurrency is $20.98 at the time of writing. Solana is trapped between the moving average lines. The bullish momentum will strengthen if the price of Solana rises above the 50-day line SMA. The uptrend will continue to the $26 high. The uptrend will be nullified if the altcoin remains trapped between the moving average lines. Similarly, if the cryptocurrency breaks the 21-day line SMA, its price will drop. The Doji candlesticks that are currently seen are the reason why Solana is trading marginally.
Solana price indicator analysis
On the Relative Strength Index, the altcoin is at level 50. The price of Solana has reached its equilibrium when supply and demand are equal. The location of the price bars between the moving average lines currently indicates a possible movement within a range. The bullish momentum has slowed down above the stochastic daily level of 60.

Technical indicators
Key supply zones: $60, $80, $100
Important demand zones: $50, $30, $10
What's next for Solana?
Solana's price is hovering between $19 and $22 and is also within its moving average line. Doji candlesticks that have slowed the price movement dominate the price movement. When the moving average lines are crossed, the altcoin will trend.

Disclaimer. This analysis and forecast are the personal opinions of the author and are not a recommendation to buy or sell cryptocurrency and should not be viewed as an endorsement by CoinIdol. Readers should do their own research before investing in funds.
Price
Price
Price
Price
News

(0 comments)