Solana Is In A Sideways Trend, But Remains Stuck Below $26
Updated: Apr 17, 2023 at 10:32

The price of Solana (SOL) is above the moving average lines, but below the resistance at $26.
Solana price long-term forecast of the price: fluctuation range
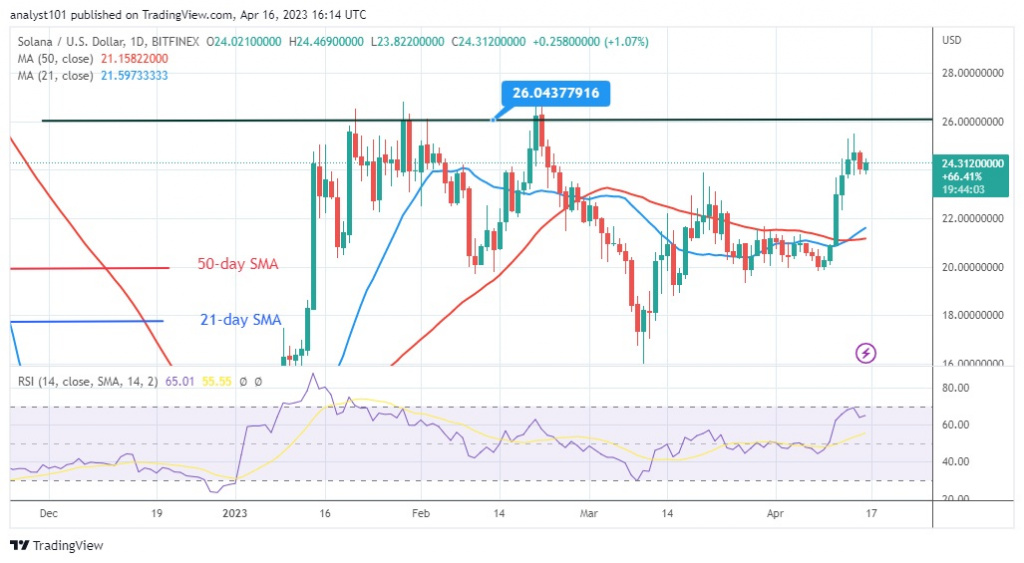
The cryptocurrency asset has risen to retest the upper resistance of $26. Today, Solana has risen to the high of $24.32 at the time of writing. However, the uptrend was stopped below the resistance area. This is the fourth time since January 20 that resistance at $26 has been retested. Solana will rally to $36 if the current resistance level is broken. However, the upside is doubtful as the market is approaching the overbought area. Nevertheless, the altcoin will continue its movement within the trading range if buyers fail to overcome the recent high.
Solana price indicator analysis
The Relative Strength Index for period 14 shows Solana at level 65. The altcoin could rise as it is in the bullish trend zone. The price bars are above the moving average lines, which shows that the value of the cryptocurrency could increase. Solana is currently trading in a bullish momentum above the daily stochastic level of 25. A sideways trend is indicated by the horizontal slope of the moving average lines.

Technical indicators
Key supply zones: $60, $80, $100
Important demand zones: $50, $30, $10
What's next for Solana?
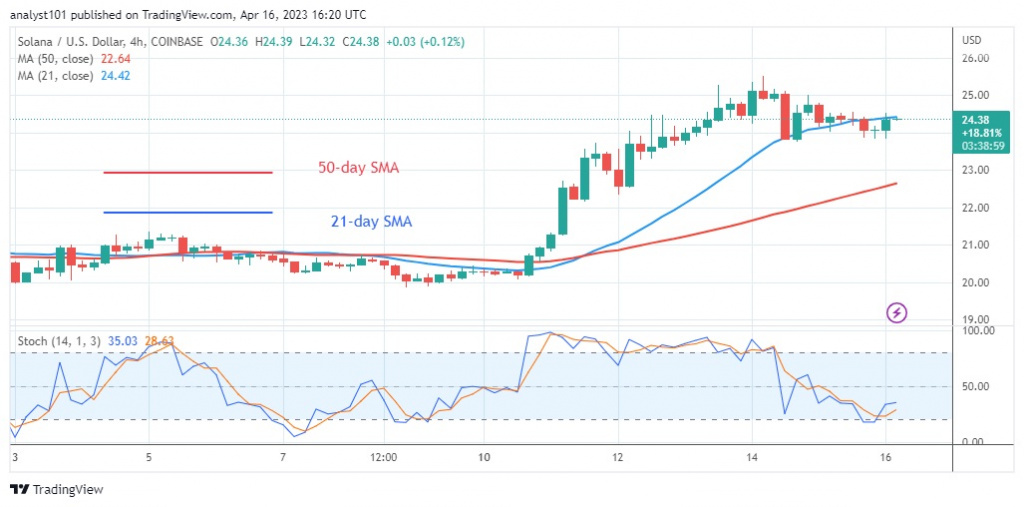
SOL/USD will continue its sideways movement if it fails to overcome the resistance at $26. On the 4-hour chart, Solana has fallen between the moving average lines. This indicates a possible range-bound move for the cryptocurrency. The altcoin will only develop a trend if the moving average lines are broken.

Disclaimer. This analysis and forecast are the personal opinions of the author and are not a recommendation to buy or sell cryptocurrency and should not be viewed as an endorsement by CoinIdol. Readers should do their own research before investing in funds.
Price
Price
Price
Price
News

(0 comments)