Solana Remains Stable, Holds Above $85 Level

The price of Solana (SOL) is stuck between the moving average lines and is currently in a sideways trend. Price analysis by Coinidol.com.
Solana price long term prediction: in the range
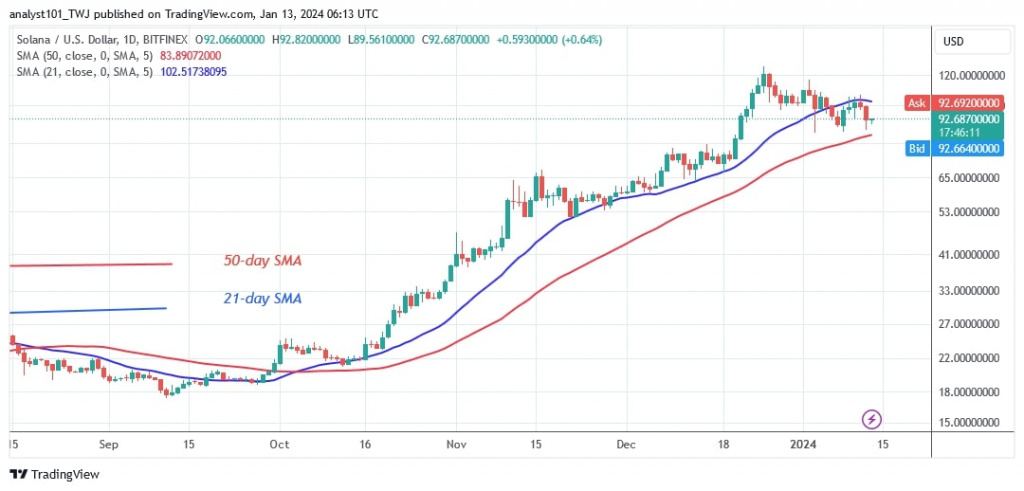
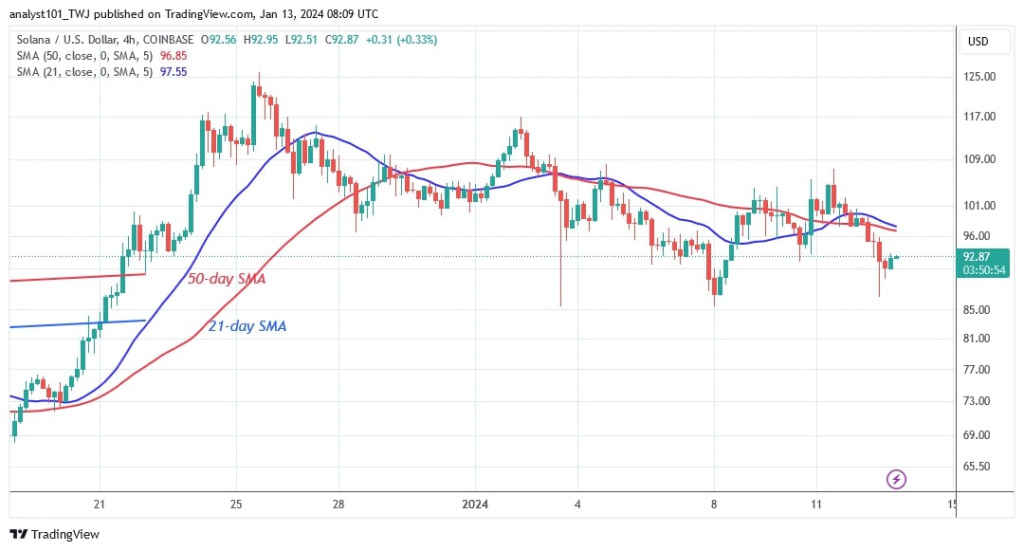
The price of the cryptocurrency has been oscillating between the moving average lines since January 6. The current value of the altcoin is $95.4 at the time of writing.
If the bears break below the 50-day SMA support, the current price level will drop. Solana will fall to a minimum of $65. However, the altcoin also has a chance to rise even higher than the previous high. The altcoin will rise above the 21-day SMA if prices bounce above the $92 support level. The bullish momentum is expected to reach the high of $120. In the meantime, the price of the cryptocurrency has remained stable between the moving average lines.
Solana price indicator analysis
The price of the cryptocurrency has settled between the moving average lines over the past week. In other words, the moving average lines have limited both the upward and downward movement. However, when these thresholds are broken, the altcoin moves up. The sideways trend is indicated by the horizontally sloping moving average lines on the 4-hour chart.
Technical indicators
Key supply zones: $80, $90, $100
Key demand zones: $60, $50, $40

What is the next move for Solana?
Solana is trading within a range and in a sideways trend. The altcoin has been trading in the overbought zone of the market. It is fluctuating between $85 and $109 price levels, as reported previously by Coinidol.com. At the moment, the presence of doji candlesticks is limiting the scope of the price movement.

Disclaimer. This analysis and forecast are the personal opinions of the author and are not a recommendation to buy or sell cryptocurrency and should not be viewed as an endorsement by CoinIdol.com. Readers should do the research before investing in funds.
Price
Price
Price
Price
Blockchain

(0 comments)