Solana Price Rise Comes To A Halt As It Falls Below $100
Updated: Jan 08, 2024 at 14:29

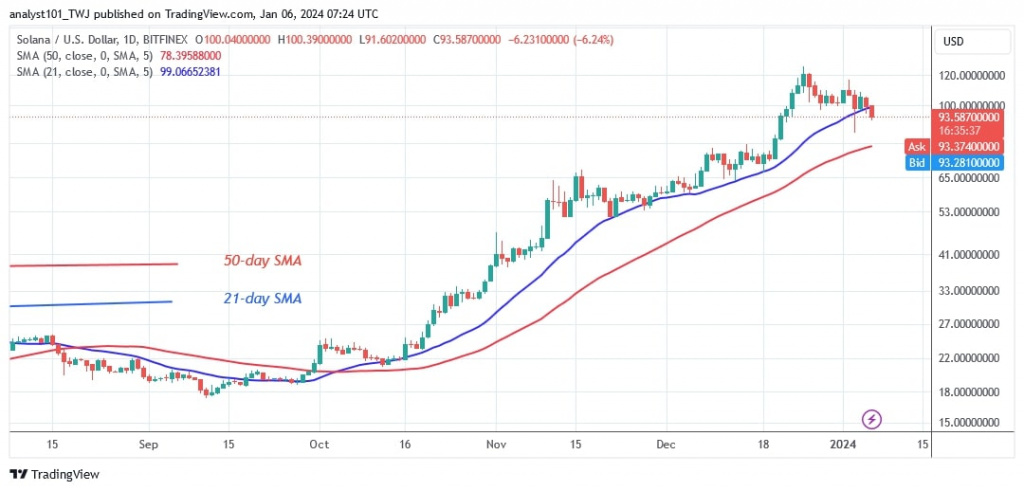
Solana's (SOL) uptrend has come to an end as the price falls below the 21-day SMA. The altcoin's rise came to a halt at $126, its all-time high.
Long-term Solana price prediction: bullish
On January 3, buyers attempted to retest the previous high but were rebuffed by the $120 resistance level. At the time of writing, SOL has retraced to a low of $94. The recent rise has ended as the cryptocurrency value has fallen below the 21-day SMA. The cryptocurrency will fall above the 50-day SMA or the $80 low if the bears are successful. However, the selling pressure will ease if the current slide is halted above the 50-day SMA.
SOL is trading between the moving average lines. However, selling pressure will increase if the bears succeed in breaking below the 50-day SMA. In the meantime, Solana is trapped between the moving average lines.
Analysis of the Solana price indicator
The price of Solana has fallen below the 21-day SMA but is still above the 50-day SMA, indicating that the cryptocurrency can fluctuate. Following the termination of the uptrend, the moving average lines continue to slope upwards. Moreover, the doji candlesticks have restricted the price movement.
Technical indicators
Key supply zones: $80, $90, $100
Key demand zones: $60, $50, $40

What is the next move for Solana?
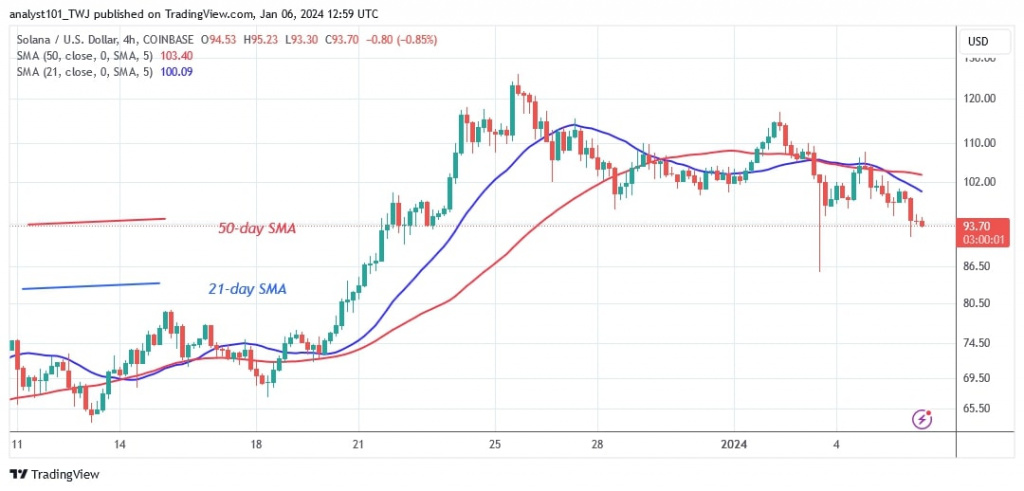
Solana posted a decline on the 4-hour chart when it fell below the $96 support. With the end of the rally, the cryptocurrency has been driven into a sideways pattern. Over the past week, the price of Solana has fluctuated between $96 and $120. The bears have broken the current support for a possible decline.

Disclaimer. This analysis and forecast are the personal opinions of the author and are not a recommendation to buy or sell cryptocurrency and should not be viewed as an endorsement by CoinIdol.com. Readers should do the research before investing in funds.
Price
Price
Price
News
Price

(0 comments)