Solana Continues Sideways Movement Below $60

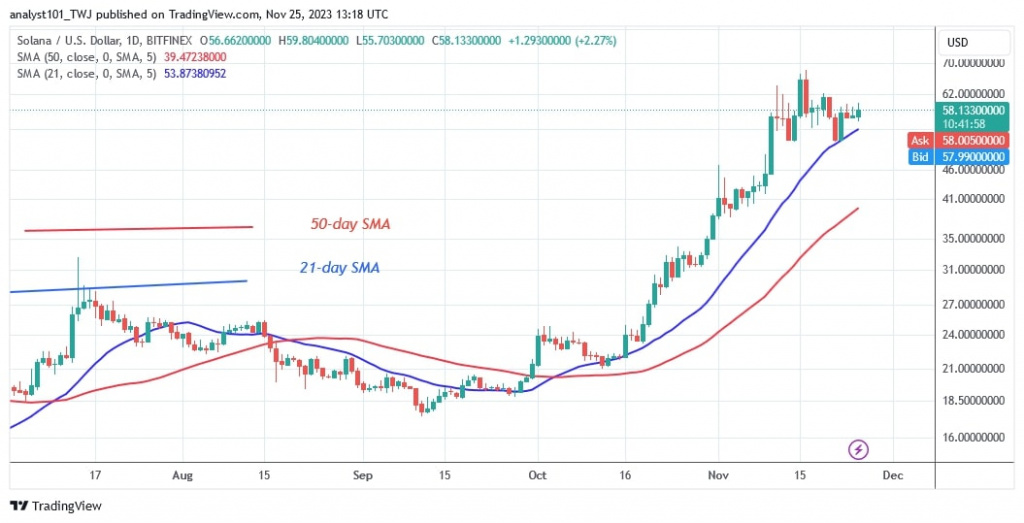
Solana (SOL) has held above the moving average lines, although the uptrend has been interrupted since November 15. The cryptocurrency is now in a sideways trend.
Solana (SOL) price long term prediction: bullish
Solana traded between $51 and $68 last week in anticipation of a positive trend. Since November 23, the uptrend has been met with another rejection at the $60 high. If the sellers break the $51 support or the 21-day SMA, the altcoin will fall.
The downside momentum will extend to the 50-day simple moving average (SMA) or the $36 support. On the upside, further gains in the cryptocurrency are unlikely. In the meantime, the market will maintain its sideways trend if volatility remains unbroken.
Analysis of the Solana price indicator
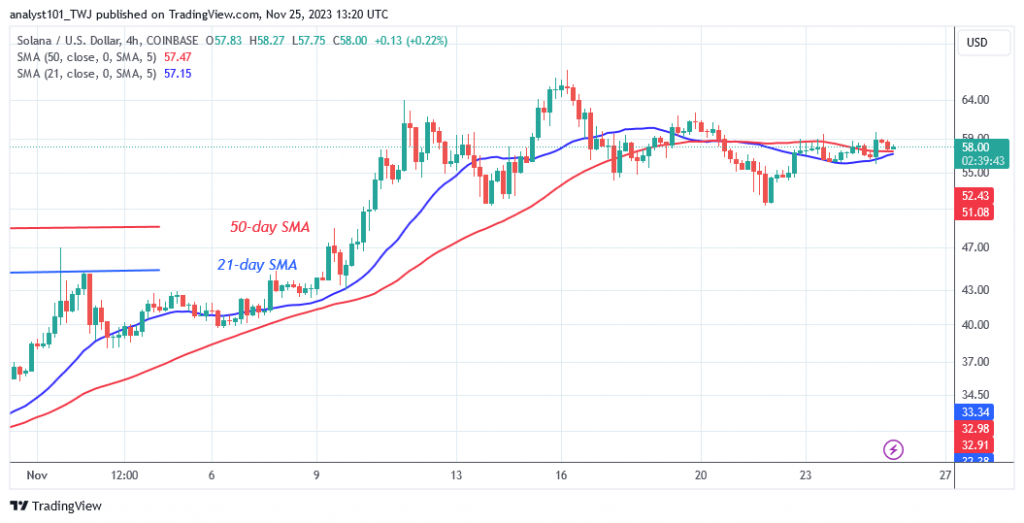
The price bars are higher than the moving average and are leaning north. The moving average lines are sloping horizontally on the 4-hour chart, suggesting a sideways trend. Selling is predicted near the recent high as the market approaches the overbought area. Solana is overvalued.
Technical indicators
Key supply zones: $60, $65, $70
Key demand areas: $30, $25, $20

What is the next move for Solana?
Even though the uptrend has been broken, Solana is trading in the overbought zone. The altcoin is trading sideways between $51 and $68 per coin. The bullish momentum has paused near the high of $60 at the time of writing. It is predicted that the altcoin will gradually decline if it encounters rejection at $60.

Coinidol.com reported on November 19 that the price of Solana (SOL) has been nipped in the bud below the $70 mark.
Disclaimer. This analysis and forecast are the personal opinions of the author and are not a recommendation to buy or sell cryptocurrency and should not be viewed as an endorsement by CoinIdol.com. Readers should do their research before investing in funds.
Price
News
Price
Price
Price

(0 comments)