Solana Loses Support And Risks Further Decline

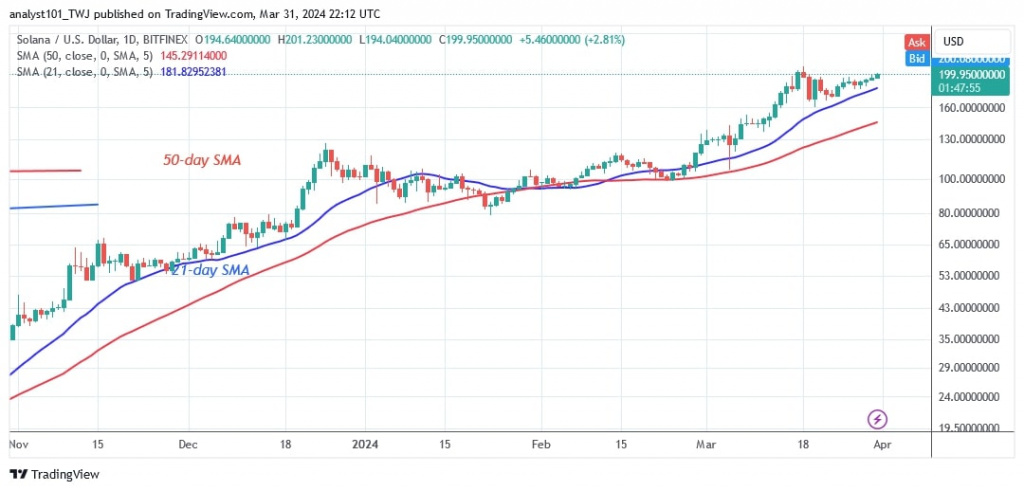
The price of Solana (SOL) is still trading above its moving average lines, but the altcoin has failed to break through the $210 level.
Long-term forecast for Solana price: bullish
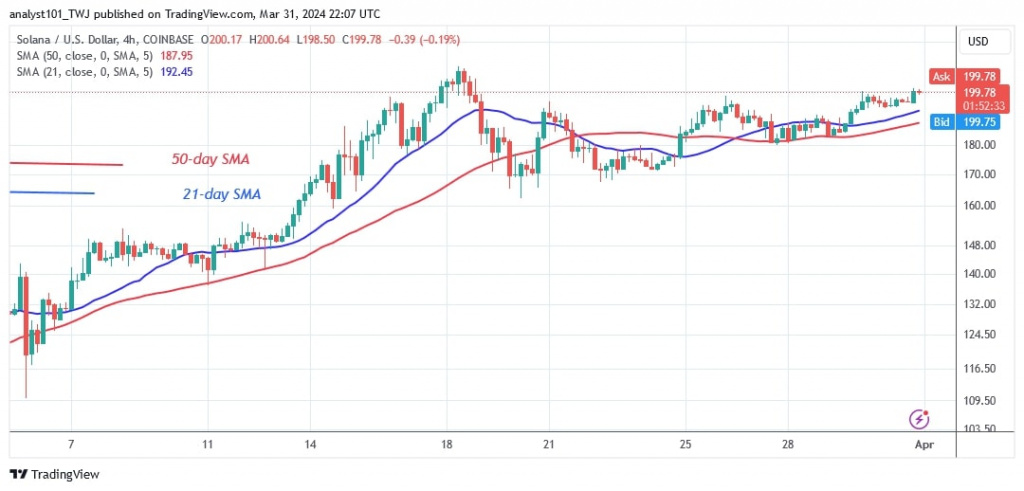
The bullish momentum was rejected twice as the altcoin fell back above the 21-day SMA. The current range between the moving average lines and resistance at $210 will continue if the 21-day SMA support holds. Solana will break above the current resistance and rise above its all-time high of $259. The altcoin will enter the bull market and trade there.
However, if the bears break through the 21-day SMA, the current upswing would come to an end. Solana will move above the 50-day SMA or the low of $147. The altcoin is currently valued at $178.
Analysis of the Solana price indicator
The price bars have pulled back above the 21-day SMA, which serves as a support line. The uptrend will continue as long as the 21-day SMA remains unbroken. If the moving average lines are breached, selling pressure will return and the uptrend will end. Solana is currently trading in the overbought segment of the market.
Technical indicators
Important supply zones: $100, $120, $140
Important demand zones: $80, $60, $40

What is Solana's next move?
Solana has been in a sideways trend since its rejection on March 18, 2024. The price of the altcoin ranges between $166 and $210. The price of the cryptocurrency has been declining after reaching a high of $200. The upward movement is unclear as the market enters the overbought territory.

Disclaimer. This analysis and forecast are the personal opinions of the author and are not a recommendation to buy or sell cryptocurrency and should not be viewed as an endorsement by CoinIdol.com. Readers should do their research before investing in funds.
Price
Price
Price
Price
News

(0 comments)