Shiba Inu Has A Bullish Trend And Targets Up

Shiba Inu (SHIB) prices are falling below the moving average lines but have risen above the 21-day SMA. SHIB price analysis by Coindol.com.
Long-term forecast for Shiba Inu price: bearish
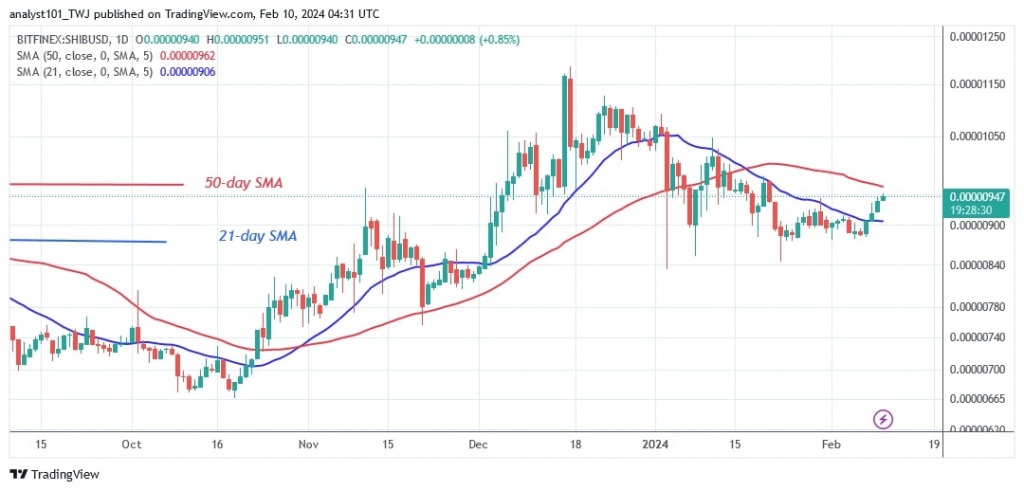
In the previous price action, the altcoin traded below the moving average lines but above the $0.00000870 support. Today, the bulls have the upper hand as the price of the cryptocurrency breaks above the 21-day SMA. The bullish momentum has extended to the 50-day SMA or the high of $0.00000965.
If the buyers push the price above the moving average lines, it will mean the continuation of the positive trend on the upside. The market will continue to rise and reach previous highs of $0.00001100 and $0.00001150.
On the other hand, if the price rises and stalls at the 50-day SMA, SHIB will fall and be forced to trade sideways between the moving average lines. If the moving average lines are broken, the altcoin will start to trend down. SHIB is currently worth $0.00000945.
Analysis of the Shiba Inu indicator
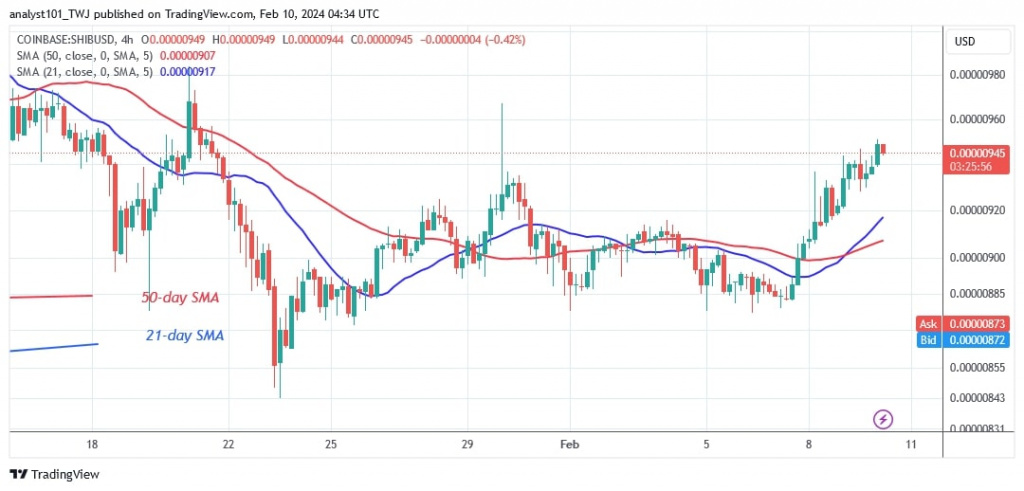
The SHIB price bars are now between the moving average lines, indicating that the cryptocurrency may fluctuate. On the 4-hour chart, the price bars are above the upward moving average lines. On the lower time frame, SHIB has a bullish crossover, suggesting that the cryptocurrency may rise.
Technical indicators
Key resistance levels: $0.00001200, $0.00001300, $0.00001400
Key support levels: $0.00000600, $0.00000550, $0.00000450

What's next for the Shiba Inu?
On the 4-hour chart, SHIB/USD is rising as it is above the moving averages. However, it is between the moving averages on the daily chart. The actual uptrend will continue if the price breaks above the moving averages on the daily chart. In the meantime, the bullish momentum could encounter resistance and force a sideways movement.
Last week Coinidol.com reported that Shiba Inu (SHIB) price has reached bearish fatigue after holding above the $0.00000870 support level.

Disclaimer. This analysis and forecast are the personal opinions of the author and are not a recommendation to buy or sell cryptocurrency and should not be viewed as an endorsement by CoinIdol.com. Readers should do their research before investing in funds.
Price
Price
News
Price
Price

(0 comments)