Shiba Inu Price Is Trapped; Moving In A Range of $0.0000086

Shiba Inu (SHIB) prices are in a sideways trend after peaking on November 6th. Today, November 11th, SHIB is trading at $0.00000832.
Shiba Inu (SHIB) Price Long Term Prediction: Bullish
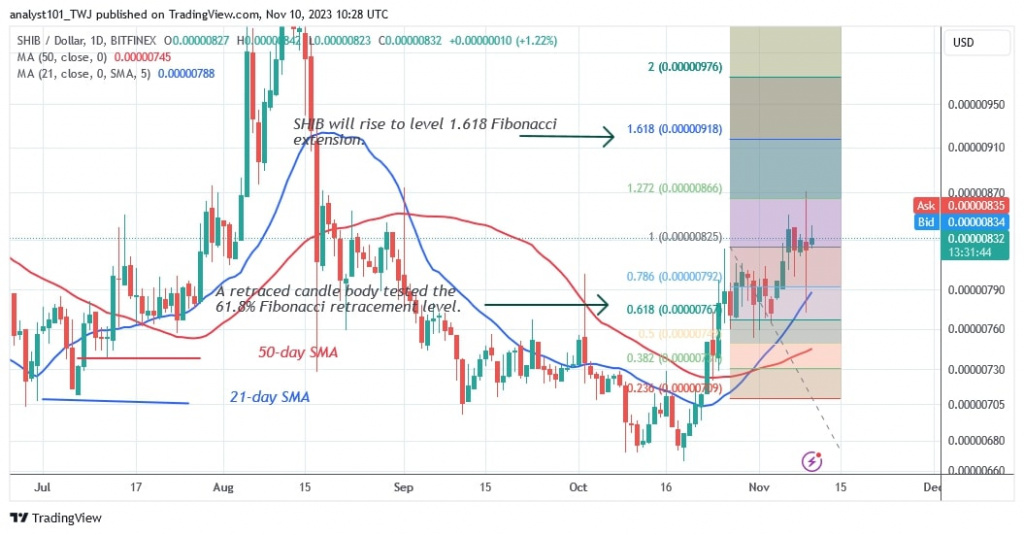
The Shiba Inu tested the resistance at $0.00000860 twice before entering the sideways trend. The price of the altcoin has moved between $0.00000800 and $0.00000860 in the last five days.
SHIB will continue its rise once the bulls can break through the current price level and move to a high of $0.00000918. If the bears break below the support level of $0.00000800, the decline will resume. SHIB will fall much further and reach the low of $0.00000750.
Analysis of the Shiba Inu indicator
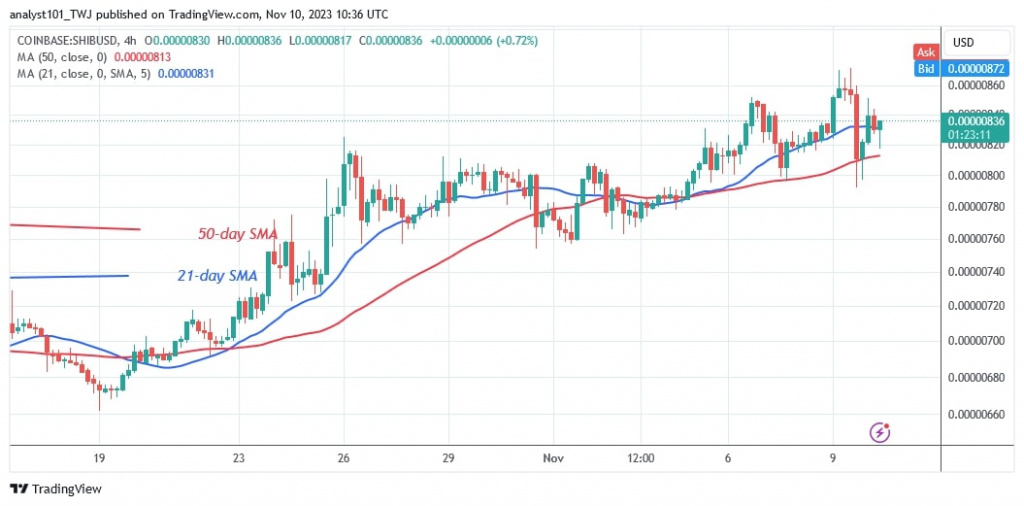
SHIB has started to move sideways. The price bars on the 4-hour chart are bouncing below and above the sloping moving average lines. The price bars have retraced above the moving average lines, indicating that the cryptocurrency will continue to rise.

Technical indicators
Key resistance levels: $0.00001200, $0.00001300, $0.00001400
Key support levels: $0.00000600, $0.00000550, $0.00000450
What is the next move for Shiba Inu?
SHIB/USD has been in a sideways trend since November 6. The cryptocurrency is trading in a price range of $0.00000800 to $0.00000860. The breakout from the trading range will determine whether SHIB moves up or down. The current trading range will remain in place for a few more days.

Disclaimer. This analysis and forecast are the personal opinions of the author and are not a recommendation to buy or sell cryptocurrency and should not be viewed as an endorsement by CoinIdol.com. Readers should do their research before investing in funds.
News
Price
Price
News
Coin expert

(0 comments)