Ripple (XRP) Rallies, Can It Overcome the Price at $0.23?

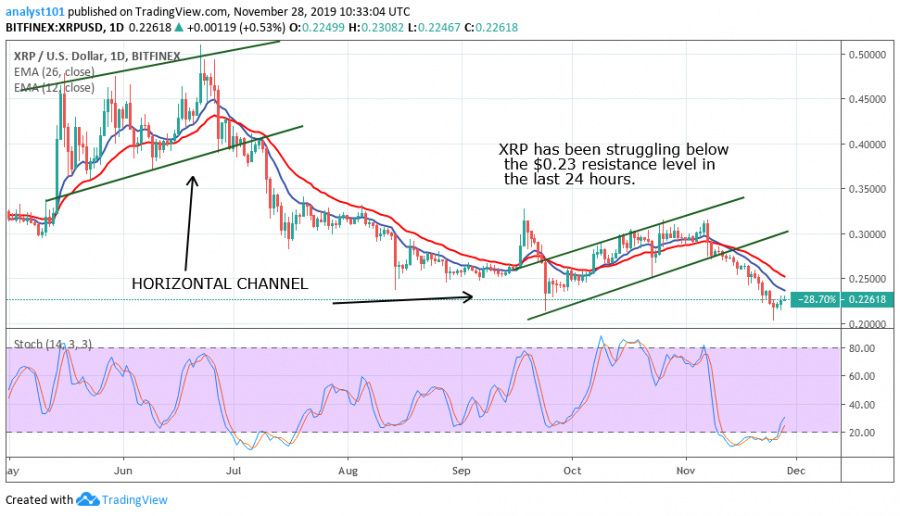
XRP survived the recent decline but the coin is still under pressure in the bearish trend zone. The coin jumped from the low of $0.20 to $0.22 just in two days but struggles below the $0.23 resistance level.
The pair is trading below the $0.23 resistance level as the bulls are yet to penetrate the previous price level. The market has been fluctuating in the last 24 hours because of the deadlock. Nevertheless, if the bulls are repelled at the current resistance, the price will fall. Also, if the price falls and breaks below the previous low at $0.20, the selling pressure will resume. On a positive view, if more buyers come in at the current price level, XRP will rally above the $0.31 price level
Ripple (XRP) Indicator Analysis
As the pair moves up, the market is still trading below the EMAs which indicates that XRP is in the bearish trend zone. In other words, the market may fall. From the stochastic indicator, XRP seems to move above 20% range that is the coin is a bullish momentum.

Key Supply Zones: $0.35, $0.40, $0.45
Key Demand zones: $0.25, $0.20, $0.15
What Is the Next Move for Ripple (XRP)?
The XRP/USD pair is still batting in the bearish trend zone. The price has to break above the EMAs before it can reach the bullish trend zone. Alternatively, it breaks above the current resistance level. If the bulls fail to meet these conditions, XRP may face another price fall. Traders may have to hold on until the direction of the market is known. Stop-loss orders should be placed below $ 0.20.
Disclaimer. This analysis and forecast are the personal opinions of the author are not a recommendation to buy or sell cryptocurrency and should not be viewed as an endorsement by CoinIdol. Readers should do their own research before investing funds.
Price
Price
Price
News
Price

(0 comments)